
Introduction to Aancore Design: Case and partner
We are a group of people from four interdisciplinary candidate teams at Aalborg University. As part of the U-CrAc/designsprint-program individual groups collaborate with different partners throughout Aalborg. Our case partner is Aalborg Slotsteater. We are assigned to find ways for enhancing the experience for the audience, to design a connection between Aalborg Slotsteater show and the exhibition at Aalborg historical museum, to create a new digital program etc. At the end of the U-CrAc assignment we will present one final idea.
Members of the team:
Lasse Svenningsen – Interactive Digital Media
Stephen Colton Cipkala – Entrepreneurial Engineering
Fanny Hvidtfeldt Hessedahl – Information Studies
Flemming Nielsen – Experience Design
Nabil Nasbo Bellanya – Entrepreneurial Engineering
Andrea Norre – Interactive Digital Media
FINAL CONCEPT VIDEO
The video shows two people entering Aalborg Historiske Museum where they stumble across a sign that says “Scavengerhunt” with a QR code. They get curious and scan the code. In the app they discover that they can now use augmented reality to gain more knowledge about the exhibition in a fun and engaging way. As a bonus they will gain discount for the Tobacco Play if they find enough QR codes.
After a couple of tasks the two people get a full discount and we see them enjoying the play. They now understand the play more beforehand, as they have gotten a lot of knowledge on the subject through the scavenger hunt.
The Design Process
First week of U-CrAc
During the first week of U-CrAc we worked with a lot of different tools to gather knowledge and get started on what suggestions we wanted to present for our case partner Aalborg Slotsteater. The week started with a joint group meeting with Martin Schwarb from the theater (all groups working with the partner took part) and ended with a meeting between our group and the case partner. During the last meeting we got Martin’s feedback regarding our suggestions.
Second week of U-CrAc
The second week of U-CrAc started with looking into the data that we collected during the first week and making decisions about the direction we wanted to take our suggestions for Aalborg Slotsteater to. On Wednesday we created 3 small videos, based on our chosen themes: Scavenger hunt, Digital Platform for Connection and Augmented Reality. On Thursday we finalized the main video for our presentation on Friday and worked on finalizing this site.
This leads to the next part of how we wanted to conduct our gathering of data.
The planned way of working and gathering data
We set out to find data in as many ways and as short a time as possible. Below we present our thoughts on that. We plan to draw up an affinity diagram and conduct interviews and observations.
Affinity diagram
With the affinity diagram we want to use because we can make a joint brainstorm of the different aspects of the case, the ideas and solutions we might develop within the group.
Field work:
Interviews and the interviewees
For our interviews, we want to address the individuals who are already interested in the theater community and who attend plays but also people who are at the museum in order to receive information on why they are going to the respective museum.
In order to do so, we will use semi-structured interviews to receive qualitative data from the respondents and what their experiences are.
Walk-Along
This is a combination between an observation and interviews, which we will conduct with Martin Schwarb from Aalborg Slotsteater. Here we want to observate the surroundings where the respective play will take place and what to obtain knowledge from Martin while showing us around. Due to covid-19, this method will have to take place with only one of our group members with a mobile observation where this person stream this to the rest of the group in order for all to observe and ask questions. This walk-along will take place at the 3rd day of the U-CrAc workshop.
Observation of the exhibition
We plan to observe people at the museum, the people who work there, the visitors and note what exhibitions get the most attention, which is most interactive. In addition, we want to investigate the surroundings and the behaviour of the audience.
Desk research:
We want to seek secondary data that support the findings we collect from the field- work of the observations and interviews. This, we want to accomplish by exploring the existing data we can find on museum guests, of the script of the respective play and additional information regarding C.W. Obel, the family and the environment.
This is done to create an understanding of what the core essence is of the surroundings, what the play is about in order to find out what is important to add in a potential solution to the case partner. This leads to the next part where the results of our work are presented.
Results of the empirical work
During the process, we found out that some solutions made more sense than others and the results of the empirical work might have turned out differently than expected because of the short amount of time we had. However, we have collected data by interviews and a walk-along/observation with Martin Schwarb (case partner) and by desk research.
The interviews
We conducted four interviews with people interested in the theater community to gain an understanding of their viewpoints on the matter. This has been done to figure out what their motives for attending theater plays are which we might use as solutions in this U-CrAc. These we have created into transcripts we later could use to elaborate on.
The walk-along
The walk-along provided us with information about the garden where the play will be held, the area and what should be considered to be included in our solution. We also had several questions for Martin which was answered and taken into account within the group.
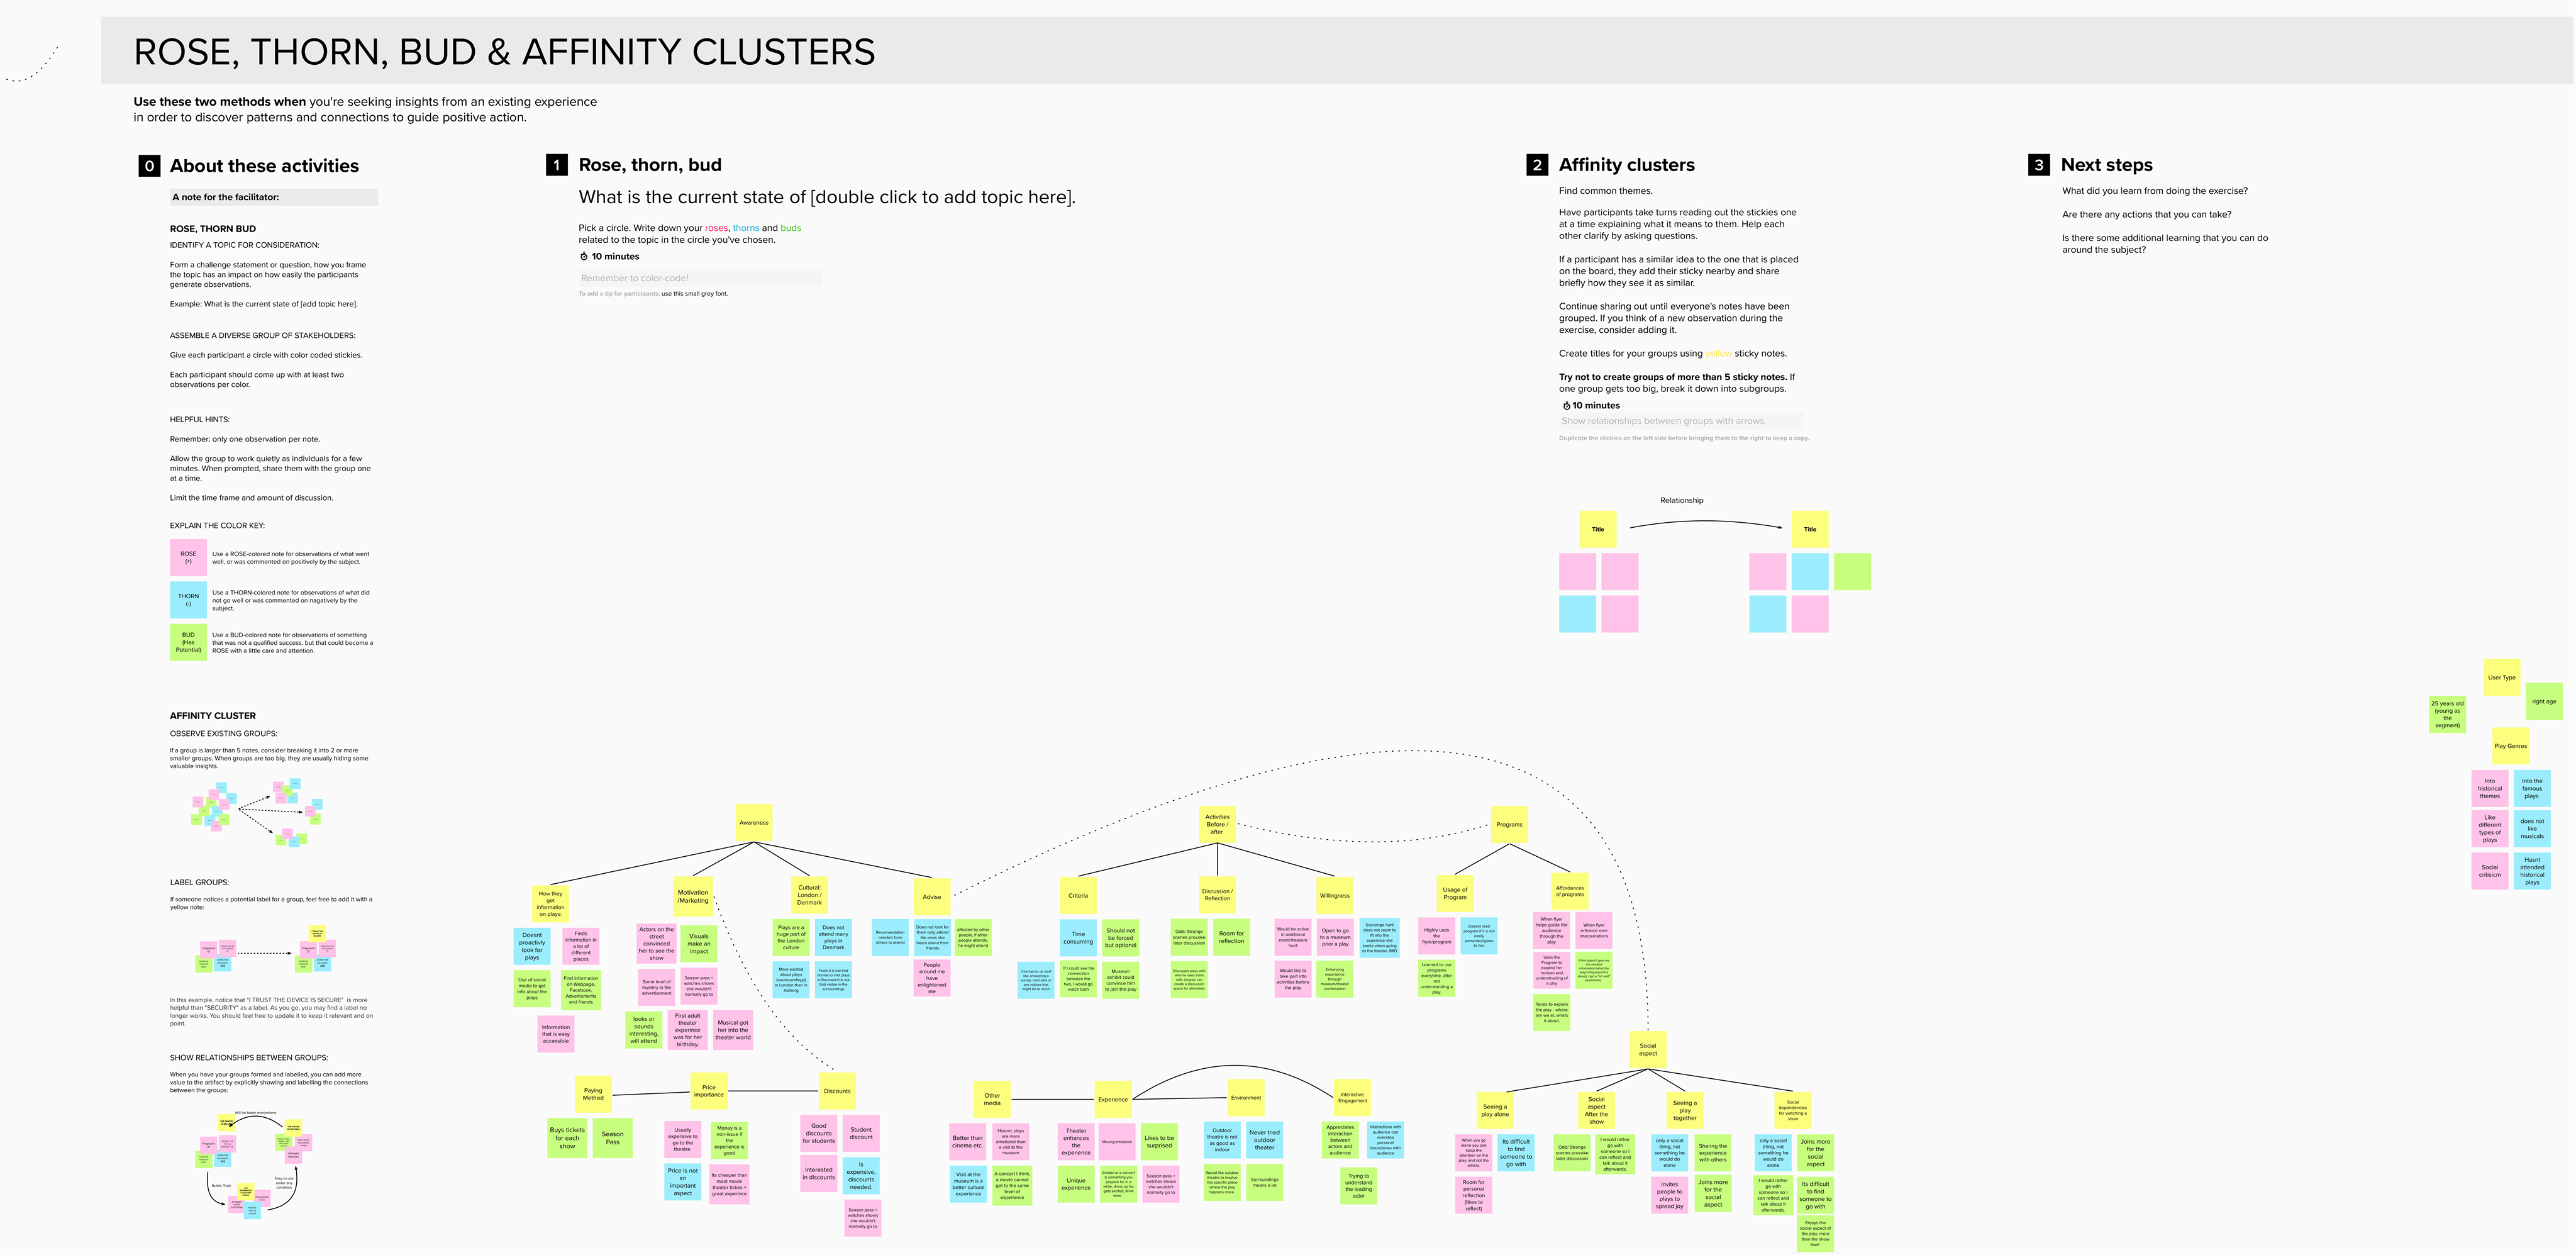
Affinity Diagram resume
We developed an affinity diagram using the ‘rose, bud, thorn’ method that highlights the key findings from the four different interviews. We then put all those findings together in an affinity cluster. Finally, we divided the similar ones into groups and gave them a fitting label.
Core-design resume
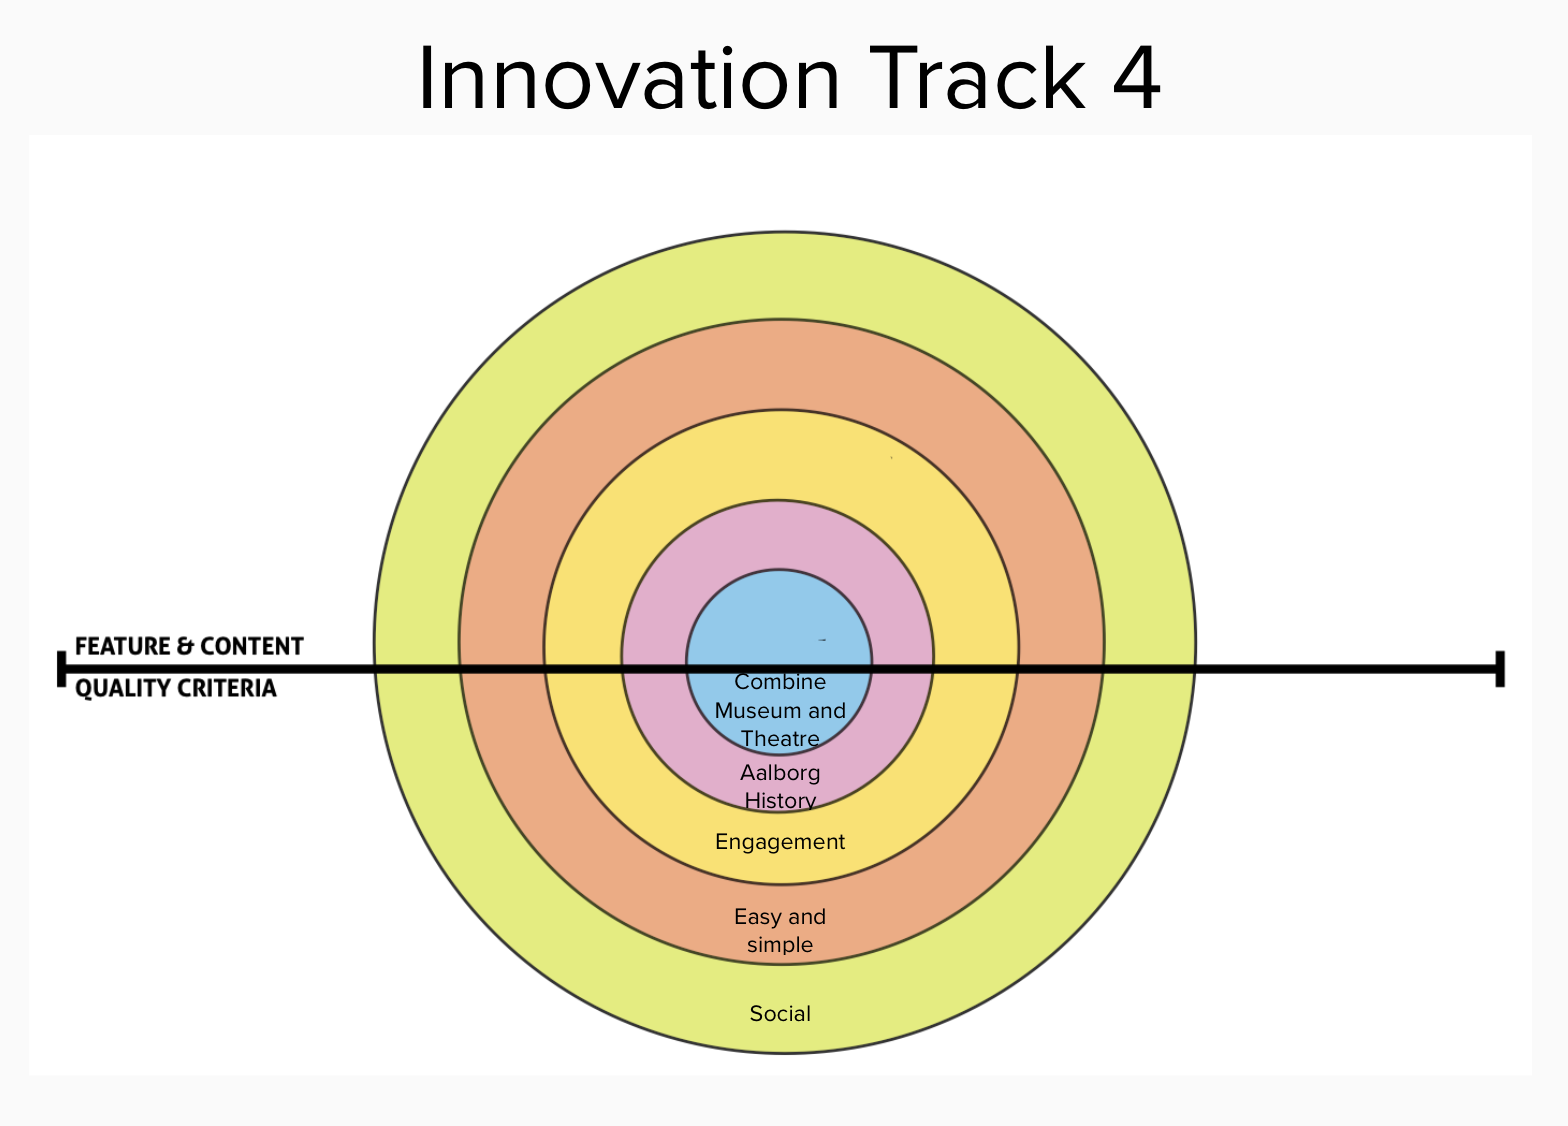
To make the final core-design we made four different innovation tracks that contain the success criteria we established on the basis of the above affinity diagram. The final innovation track (track 4) shows the quality criteria we will focus on in this collaboration.

Case partner meeting
After finishing the four innovative tracks that summed up the quality criteria and ideas within the group, we held a meeting with Martin from Aalborg Slotsteater. We presented all the information from our core-design and explained the ideas behind the different tracks.
After the presentation we had a brief discussion with the case partner and we chose to focus on track 4, because Martin was fond of the idea of combining the theater and the museum as the main core. However, he also thought that our other tracks had some interesting features. Martin believed that learning about Aalborg History was an important part of the solution. Therefore we rearranged track four and mixed it with some of the features from the other tracks. Finally, we conducted our final core-design on the basis of our negotiation and discussion and we informed Martin about one of our preliminary ideas for the solution – some sort of a scavenger hunt. Our joint quality criteria are illustrated below:
The idea is to incorporate the locations, but also enhance the learning part, while people interact with the historical aspects through the museum and the involved locations. We discussed how we might use parts of the particular play in the game. That way people who have played the game might already have a prior understanding of the story presented in the play before seeing it. We see the game as something social that becomes more fun when shared with others, and that is something we would like to incorporate in it. It should be a simple and easy game that does not take too much time.
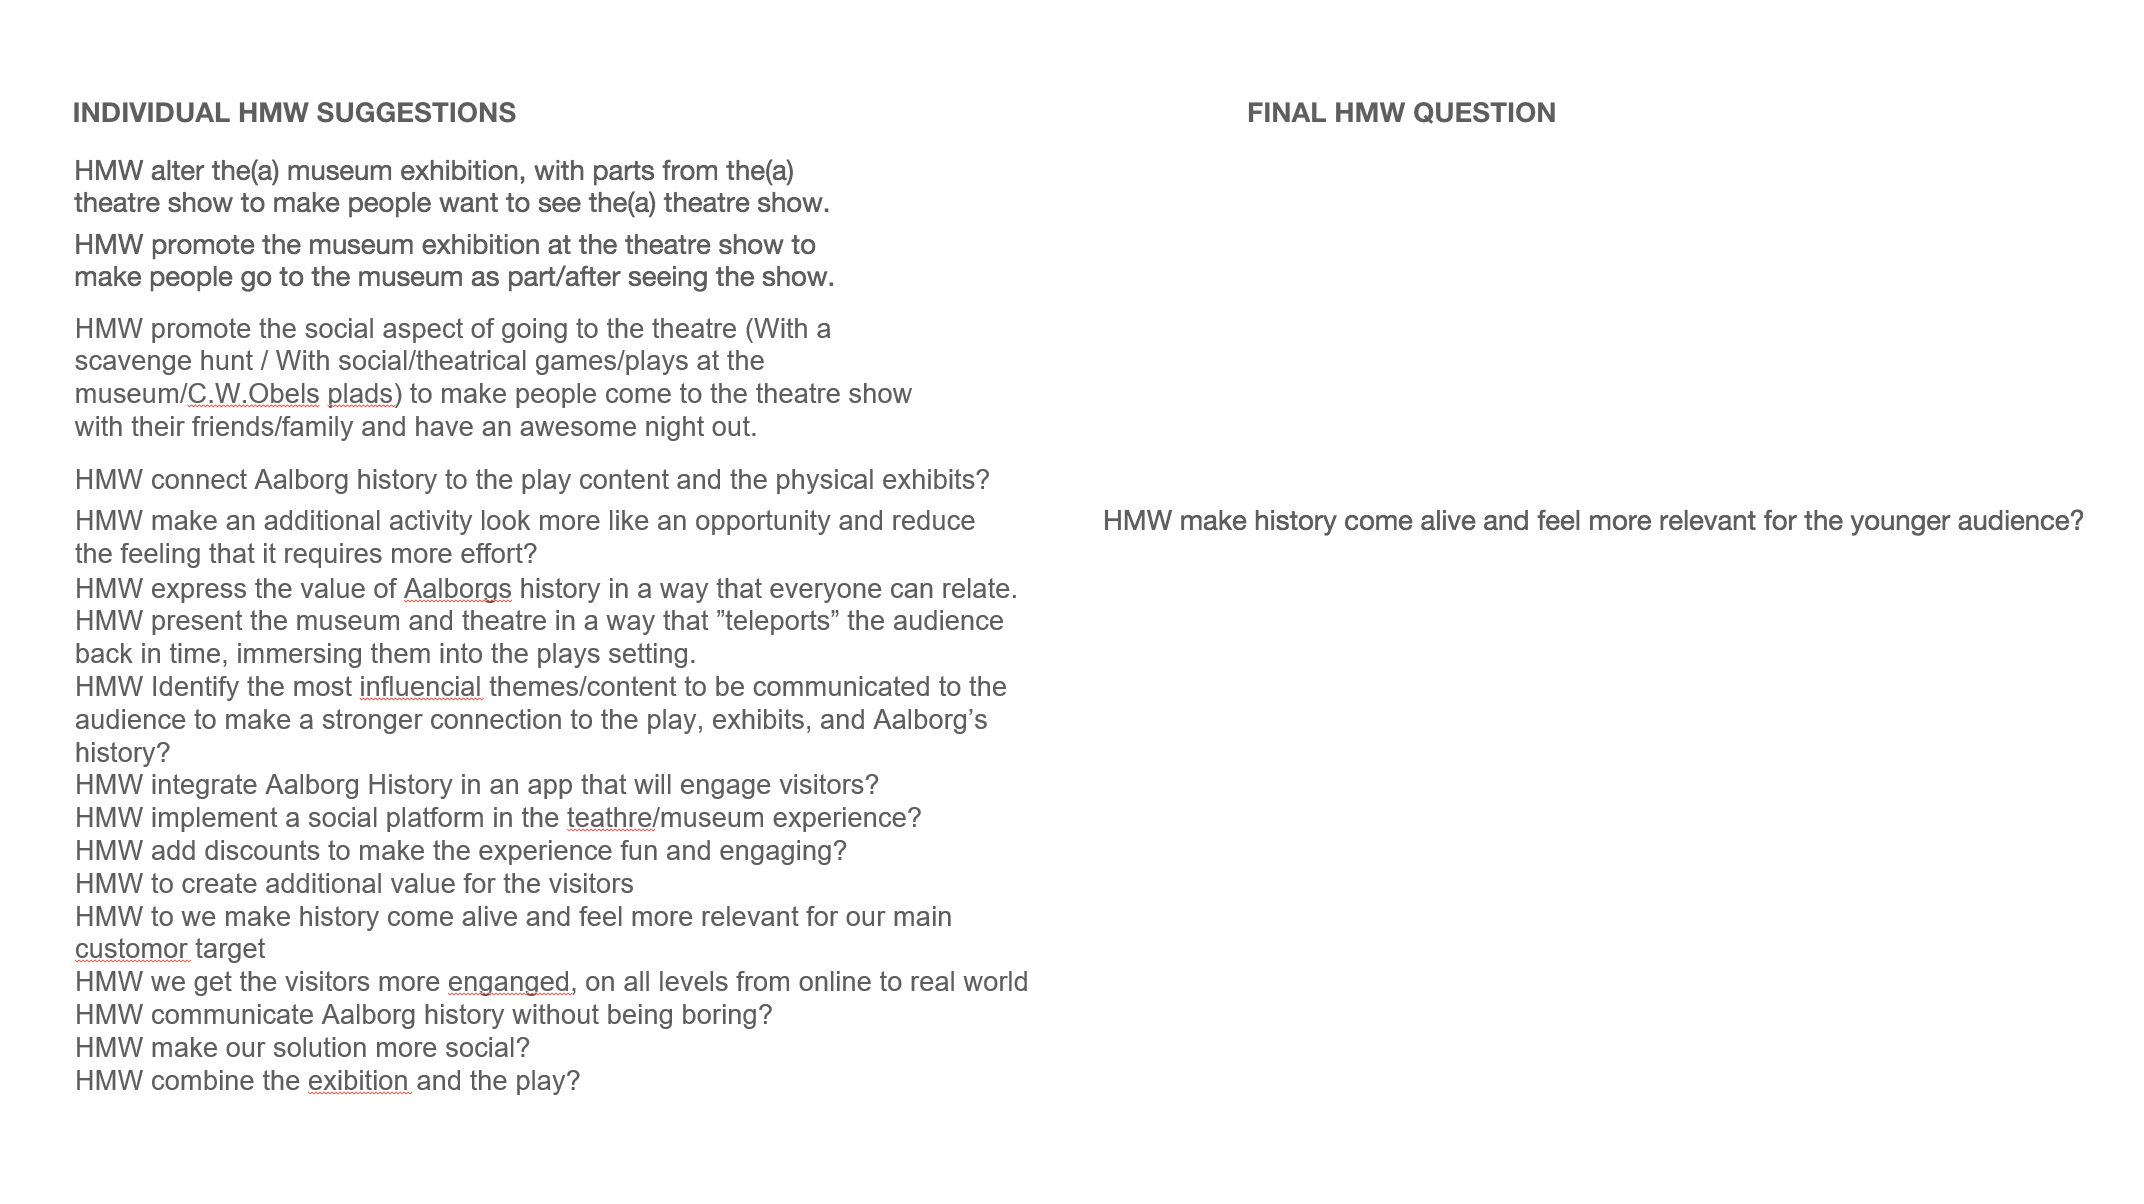
“How Might We” Questions
From our design-core we had to develop the ‘how might we’ questions that will illustrate the broad aspect of ideas within the group. Each of us had ten minutes to form three questions regarding the ‘how might we’ approach as a solution and then we voted for the best question.
We put the final HMW question into the global maxima ideation where we elaborated on how we were able to use this idea in practice and to conduct our ideation framework. We conducted eight ideas from the final HWM question and then discussed and voted ob which five ones we should focus on. This is illustrated on the two following images:
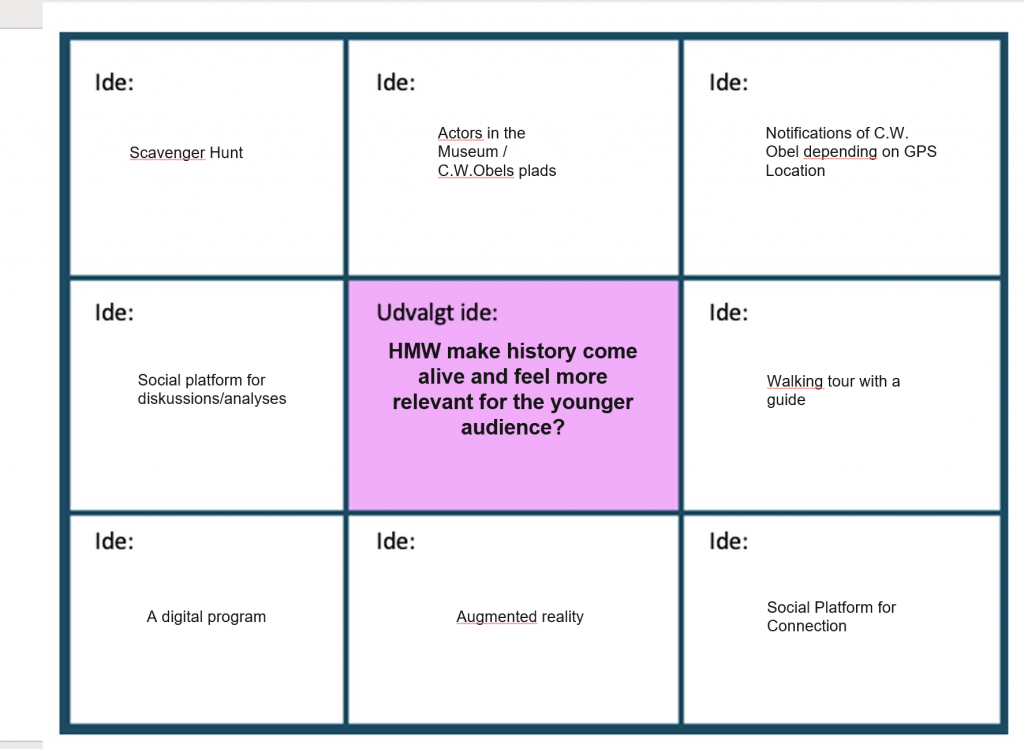
Figure 4: The global maxima 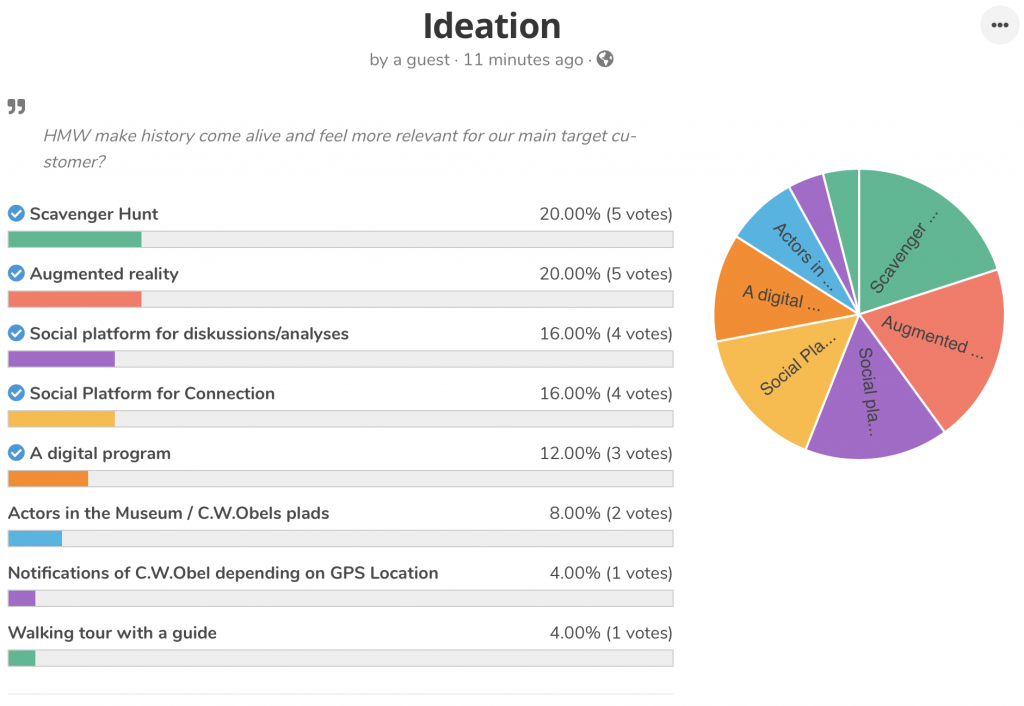
Figure 5: The voting within the group
Furthermore, when selecting the five categories we put them into their own diagrams where we conducted the local maxima. Here we elaborated further on what the categories might contain more thoroughly and how to improve and refine the ideas we had. This then ended up with the following five ideations:
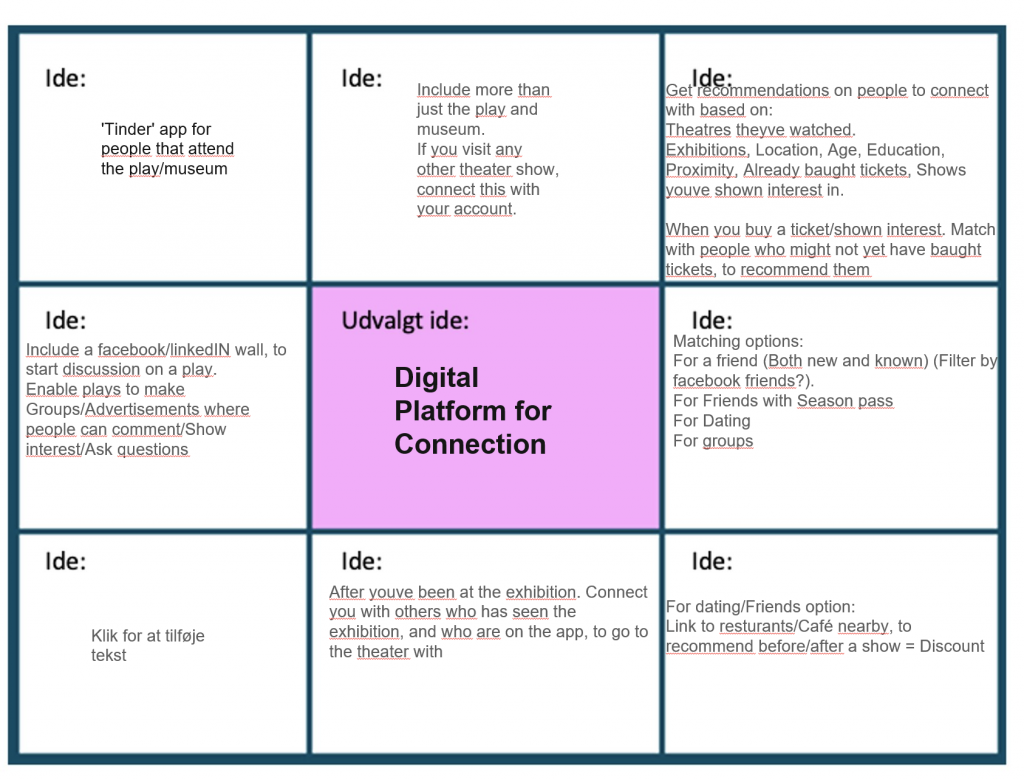
Figure 6 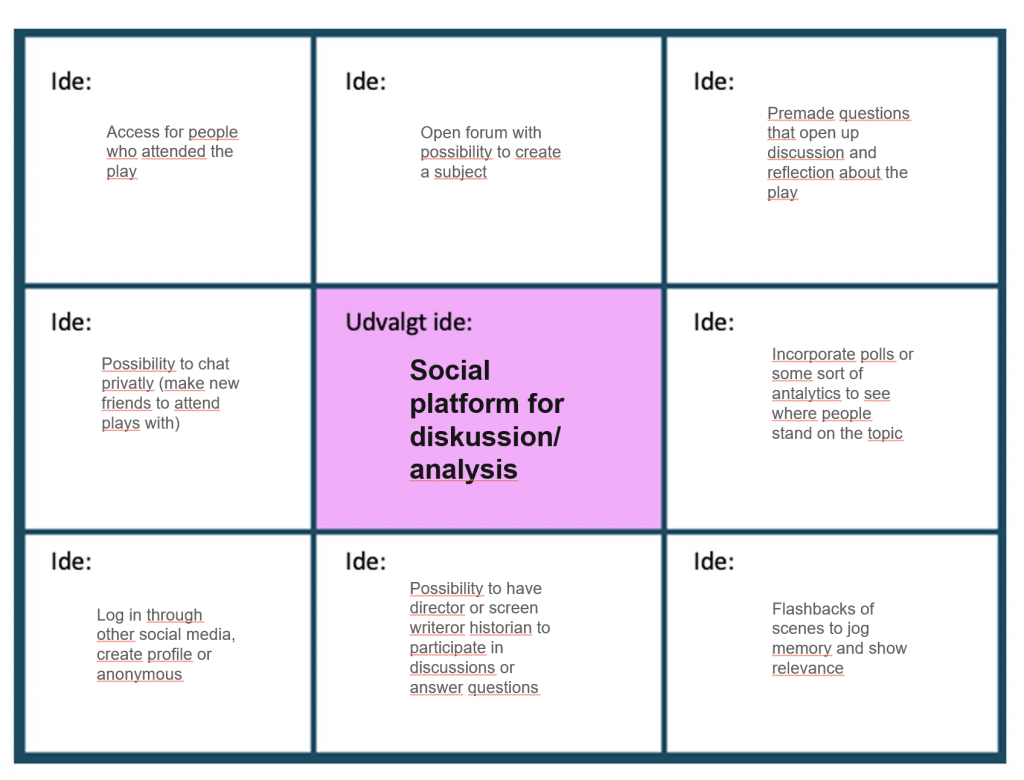
Figure 7 
Figure 8 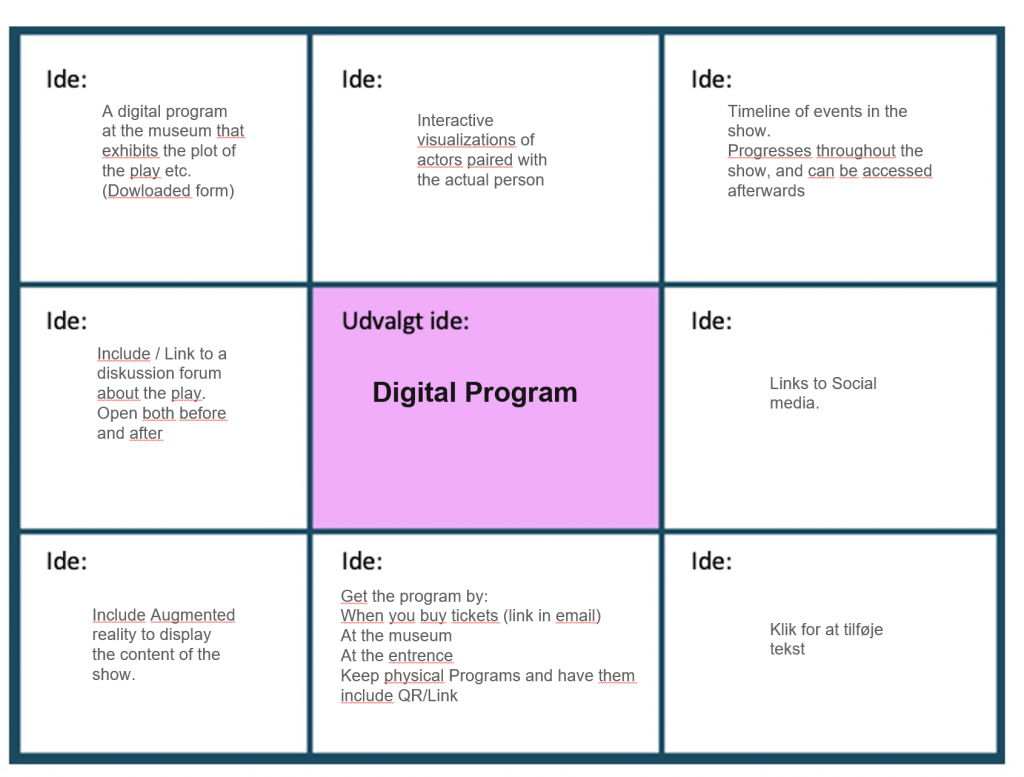
Figure 9 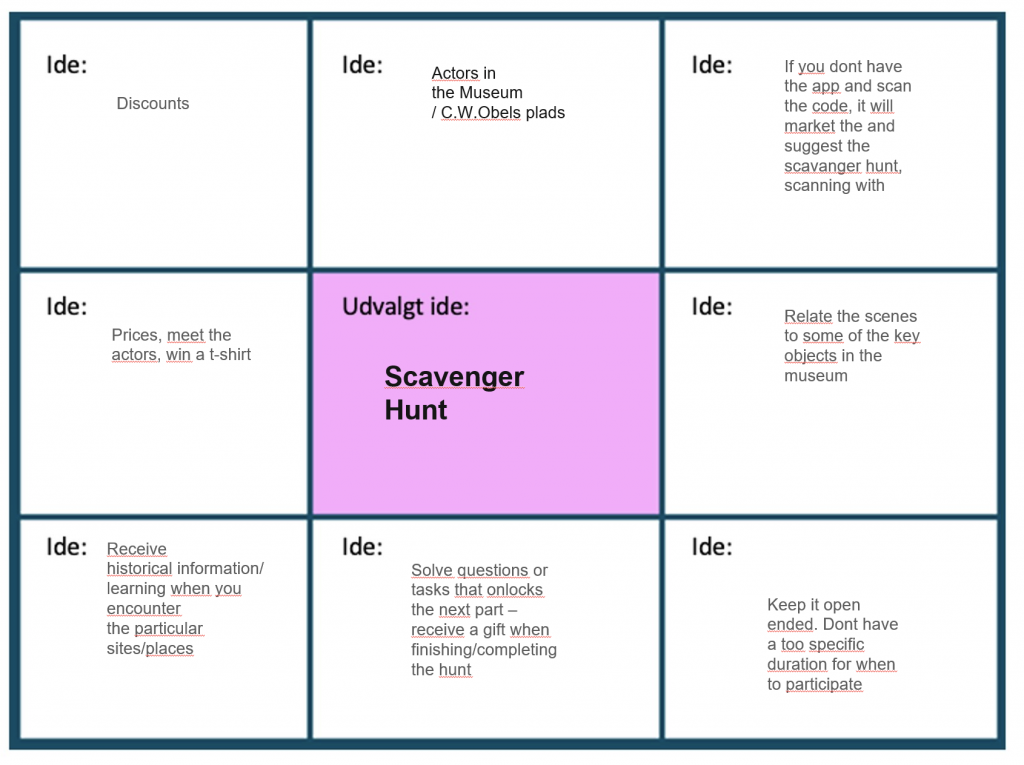
Figure 10
Finally, we evaluated these five ideations in the local maxima against our final HMW question and we selected the three favorites.

We chose the three ideations that had the most votes. Those were Scanvenger Hunt, Digital Platform for Connection and Augmented Reality.
Sketches of the concept
In this part of the U-CrAc we tried to visualize the three ideations that we earlier had chosen to elaborate. We wanted to use Stop Motion as a tool to make our sketches by using an animation box/standscan. We used all of Wednesday of week 2 to draw sketches of the characters that should appear in the videos and used the animation box in the production of our images. Finally, we edited our video sketches in Adobe Premiere Pro in order to transform our images into the videos as shown below:
Description of Scavenger Hunt
The video illustrates that two friends discover a scavenger hunt on a poster in front of the Aalborg Museum. They download the app by using the QR code provided on the poster, start playing and receive trophies based on how many posts with QR codes they find. In the end they find all of the posts and win a prize.
Description Digital Platform for Connection
The video is about a girl (Dana) who doesn’t know what to do this weekend. She wants to do something else than staying at home and watch Netflix.
She creates an account on the (well known) app, Theater Match. This app is like Tinder/LinkedIn – one can post what cultural events one has attended (e.g. museum exhibits, theater plays, cinema film etc.). We then see Brian who has just been at the exhibition at Aalborg Historiske Museum. He enters this is the app. Dana finds the play “Tobacco” interesting. And as Brian has just seen an exhibition connected with C.W. Obel and the play, they get matched (they are in general a match based on age, proximity, education interests etc.). They use the chat option to set up a date and meet to watch the theater play together.
Description of Augmented Reality
This video is about someone who uses a mobile phone and QR codes to get the access to augmented reality layers on their phone. In the exhibition about C.W Obel he used the phone to gain knowledge about history presented e.g. by means of people in their natural surroundings. At the end of the video the character is thinking about how good it was that the augmented reality app got him interested enough in the story to go see the play.