
Affinity Chart
Based on the interviews and observations from Gustav Hansen and their partners, we divided out the main points gathered from each interview out to which person who said it. This was written on post-it notes on Miro, as well as colour-coded based on whether they worked for Gustav Hansen or not. Lastly, each note was given a label, in order to categorise in terms of professions. This created 10 different charts, one for each person interviewed.
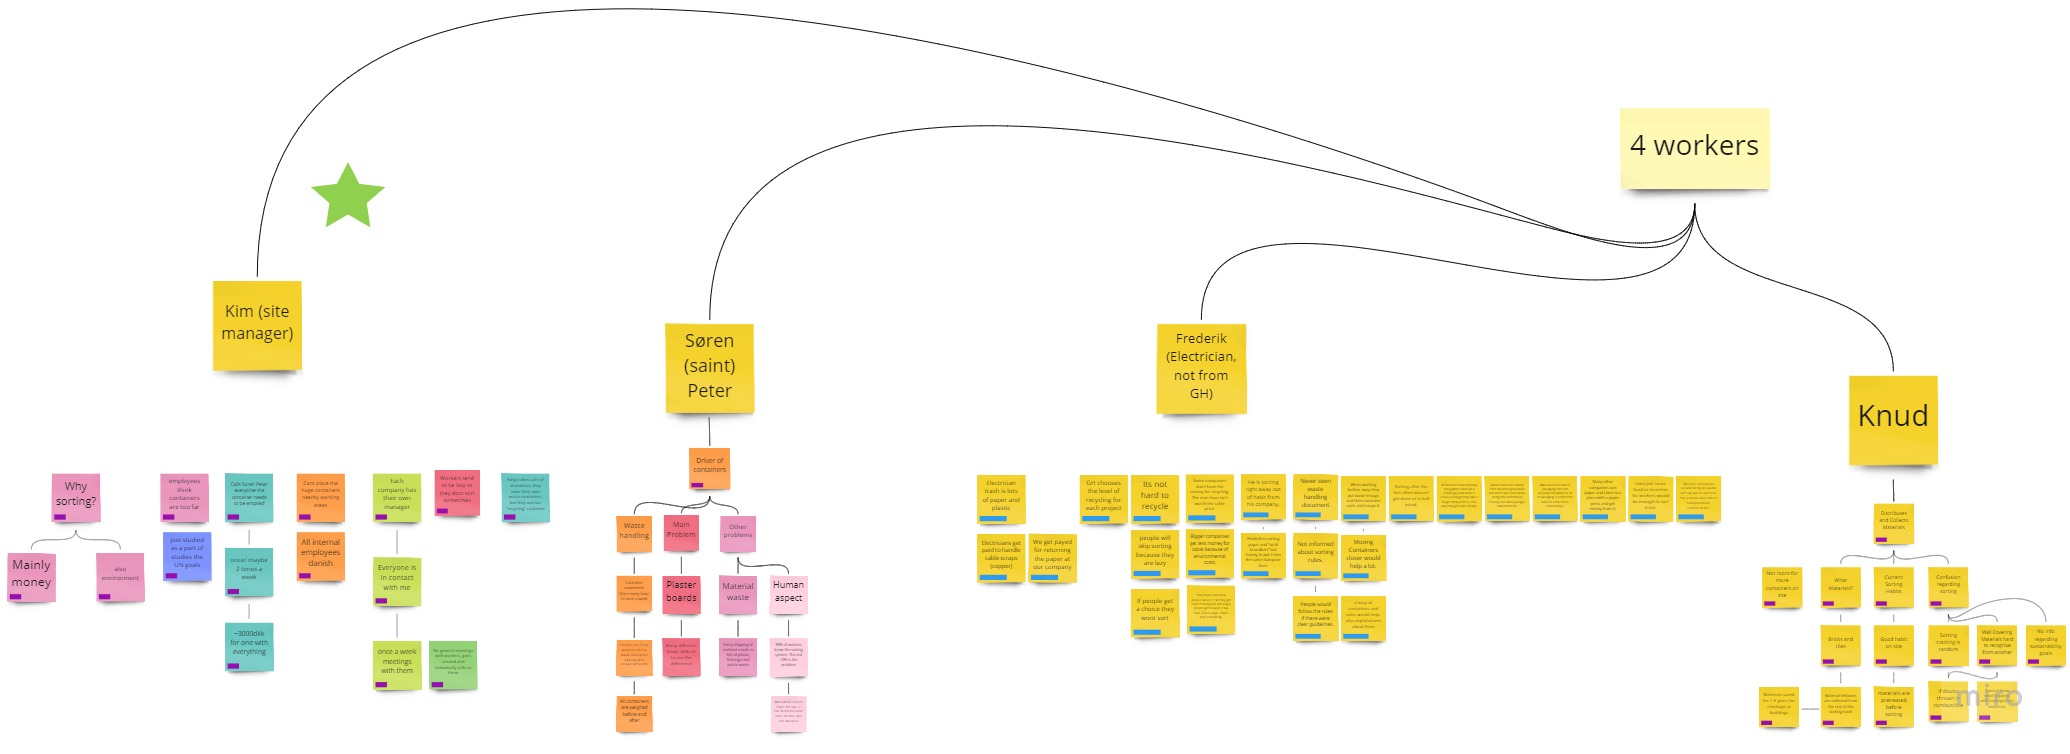

With these created, we then started to look at the different interviews and divided them out into different overarching categories in an Affinity Chart. This was done by going through each interviewee and discussing in the group what category it could either fit in or create, if not fit for an existing one. This created 5 different categories
- Red bubble: Sustainability in Business. This contains general observations regarding sustainability in the different interviews.
- Blue bubble: Reasons for Bad Recycling. This covers several issues mentioned in the various interviews regarding waste disposal habits.
- Green bubble: Value from Waste. This covers the tangible and intangible values that the different companies see in waste.
- Grey bubble: Current Waste Handling Process. This bubble covers the current procedure of waste handling within Gustav Hansen’s firm based on employee interviews.
- Purple bubble: Other Sustainable Practices. This bubble covers other sustainability issues outside of the waste recycling theme.

Click here for a better quality image
Core Designs
Having created the Affinity Chart, the group started looking at different core designs based on the results. We came up with 4 initial tracks of innovation.
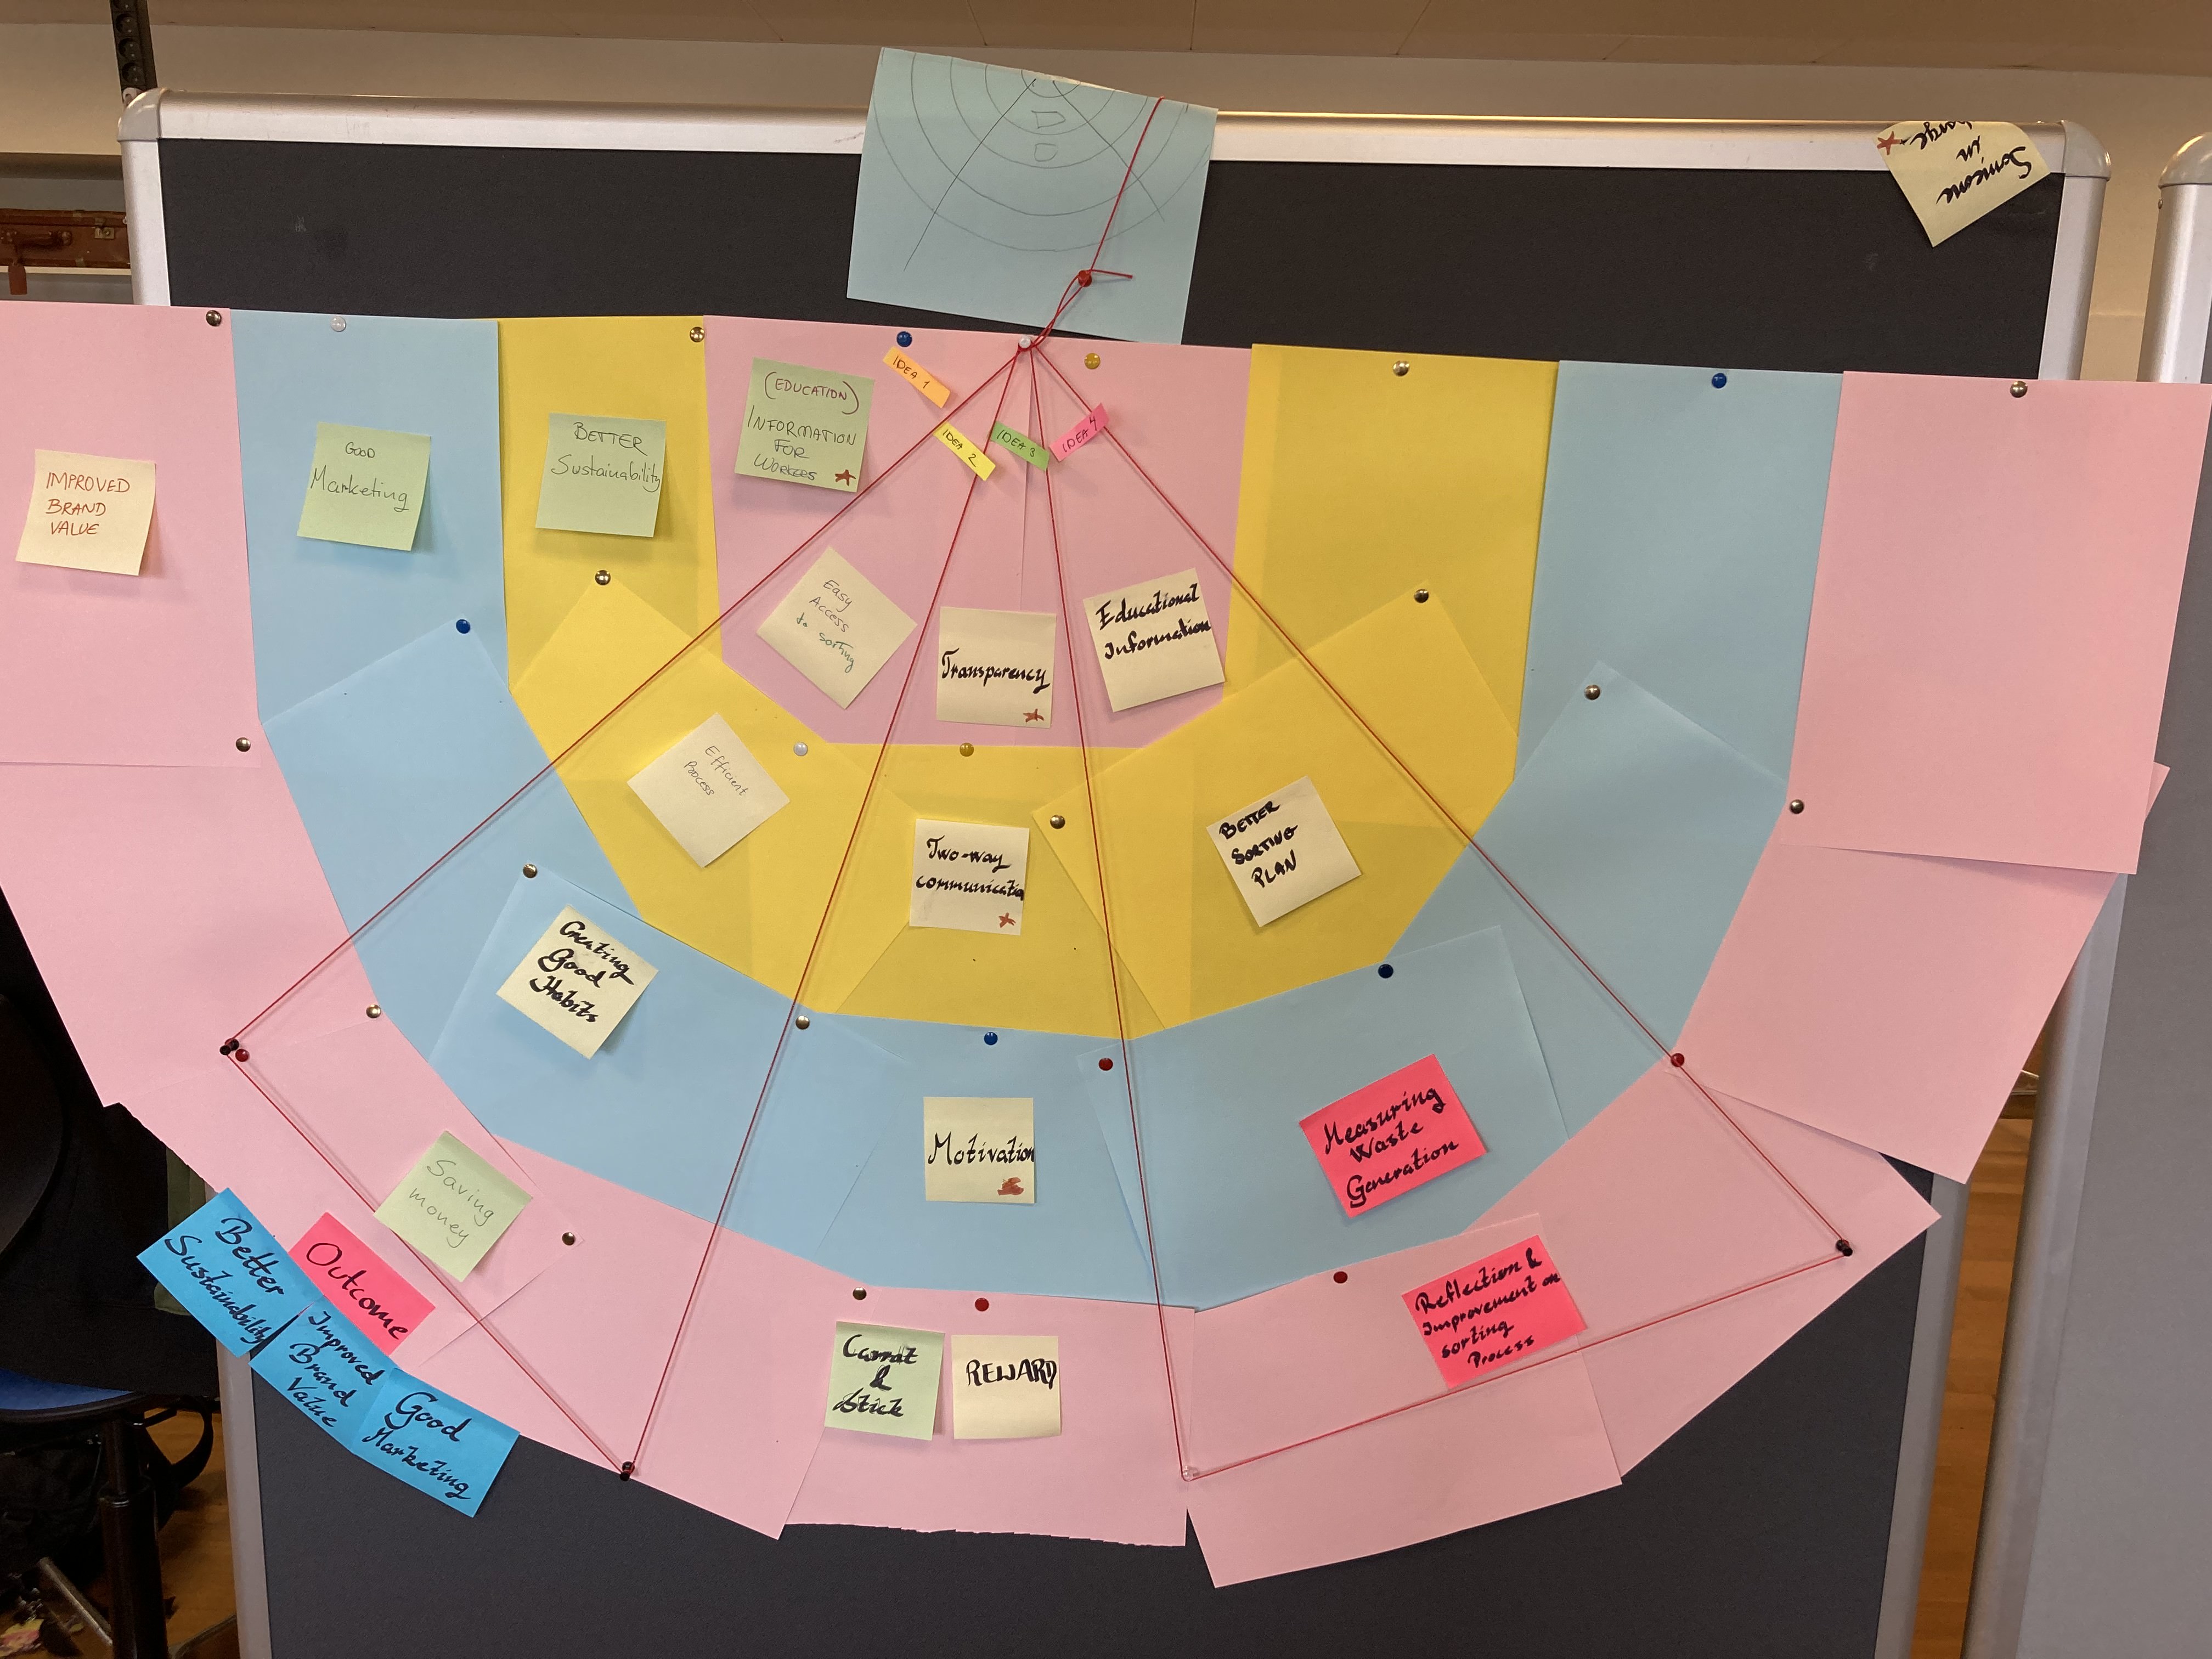
Based on the meeting with the case partner, they wanted us to focus on the fourth innovation track while incorporating some aspects on the other innovation tracks as well since they supplement each other.

The core idea of the fourth track is Flexibility. We plan to implement this by improving their sorting plan. They can be improved by reflection and by measuring waste generation. That is because the stakeholders vary from project to project which creates a need for a flexible solution.
Ideation: From Quality Criteria to Ideas
The team used individual brainstorming to come up with 3 “How might we questions” and then present and discuss them which led to a final Sprint Question that defines the focus.
The question is: How might we create a non-disruptive sorting process/plan that can be adapted and iterated on various types of projects.
)
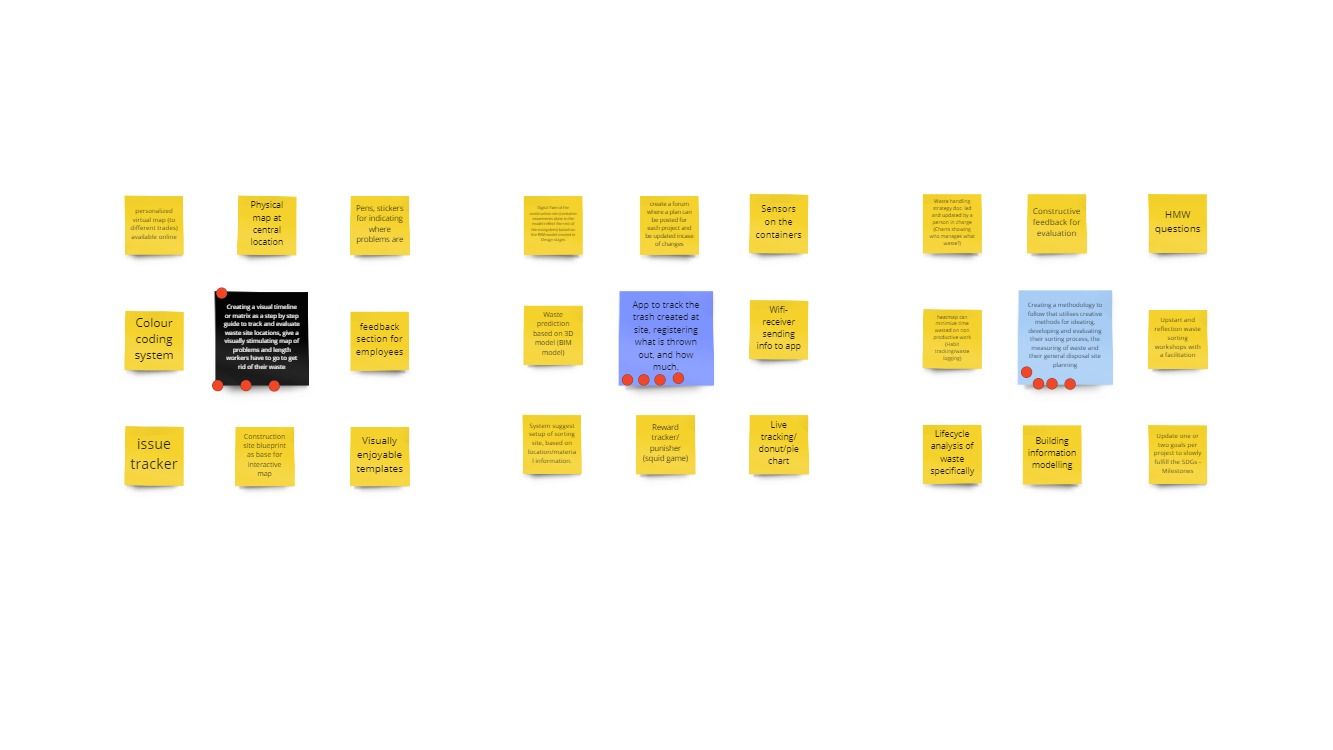
Using the HMW matrix the team individually brainstormed eight overall ideas which were narrowed down to five of them.

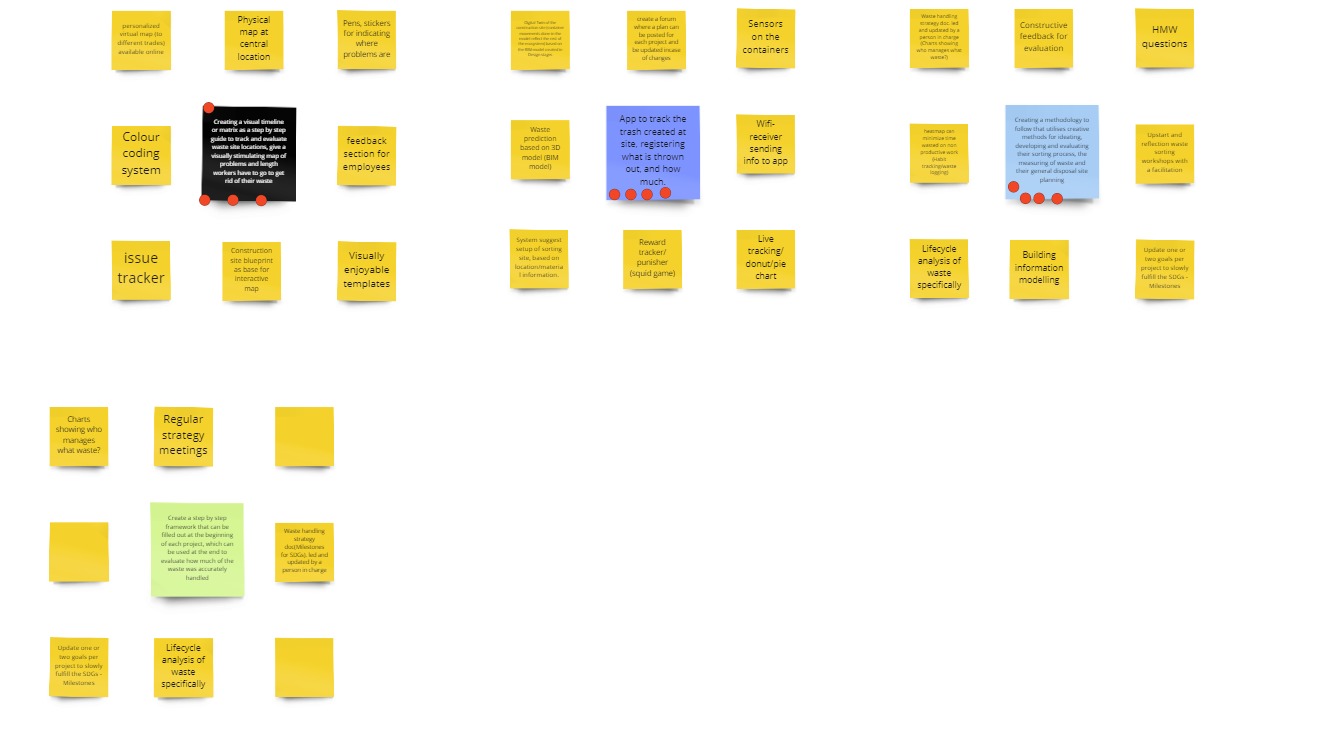
This has further been narrowed down to the three main ideas visible in the image by dot voting:
 Sketching the initial ideas
After the ideation session, we brainstormed storyboards for each of these solution ideas and created draft sketches of them as stop-motion videos. These drafts can be viewed below.
AVS 1 – https://youtu.be/6qmyLxWtPHU
AVS 2 – https://youtu.be/WlV4v5HGLBA
AVS 3 – https://youtu.be/tywS8rDGmY4
Design Critique and Feedback
Based on the feedback we received from our colleagues and professors, we decided to combine the first two sketches into one sketch that serves as an example of possible ways to implement tools to achieve the UN sustainable goals, while keeping the third solution as the broad “main” solution.
This solution focuses on the innovation track we chose of “Flexibility” which enables Gustav Hansen, as a company to be more flexible in implementing tools to tackle the issue of improper waste handling.