

Initial Data Sorting and Affinity Diagram
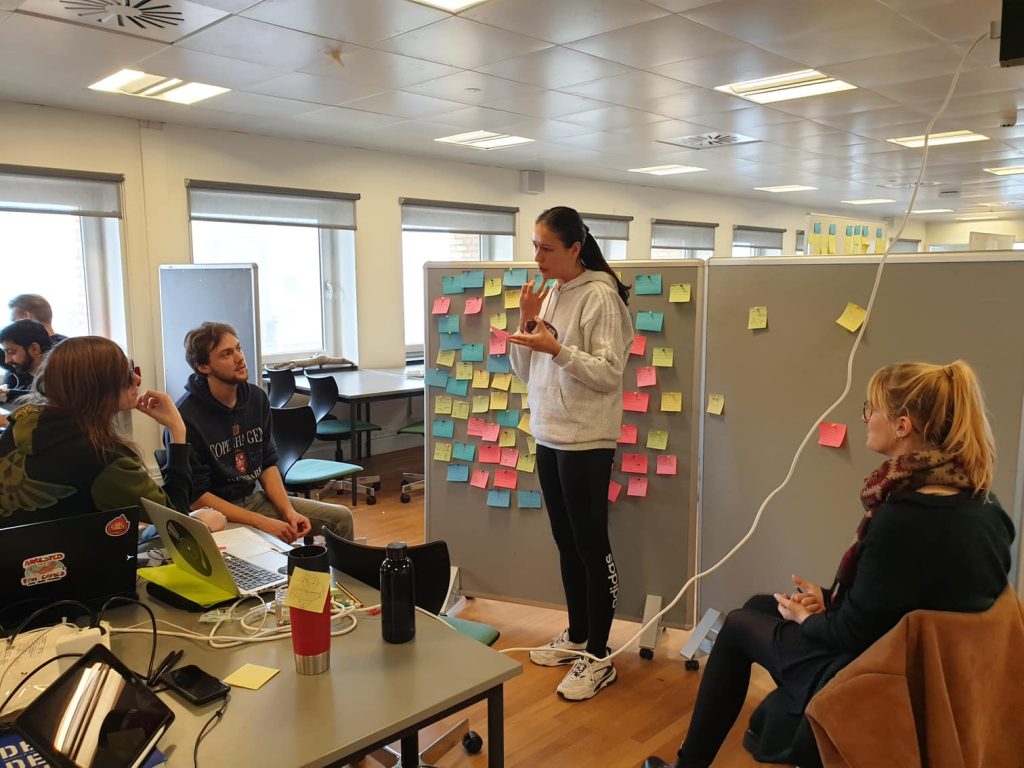
The initial process started with noting down the different bits of relevant data on different sticky notes, which were color-coded in accordance with which interview they originated from. All of the post-it notes were then collected together on a wall, as seen in the image below.

Afterwards, each group member took 3 sticky notes they had written, and presented the data on that note to the rest of the group. The group would then place the note on another wall, grouping them together based on similarities within the data.

After all data points were put into different groups, each group was given a specific title, based on the shared characteristics of the data points present within it. Furthermore, 2 data points, which were initially grouped together as their own category, were merged into another category, due to the group determining that they did not hold enough significant insights to warrant their own category.


After each category was given a title, certain individual data points were moved over to different categories. This was done as these data points aligned more with the overall characteristics of a different category, than the one they were initially placed in.
Core Design – Finding Quality Criteria
After we made an affinity chart based on our found data. We looked at our grouped areas to find a problem area to work on. By finding this area we used Design Frame Work to find quality criteria.
Based on this method, we should be able to identify the core issue of our case, based on our Affinity diagram.
We used this method to identify the core problem and find potential innovation tracks, which we will present to our case partner and arrive at a focus area to further work on design concepts.
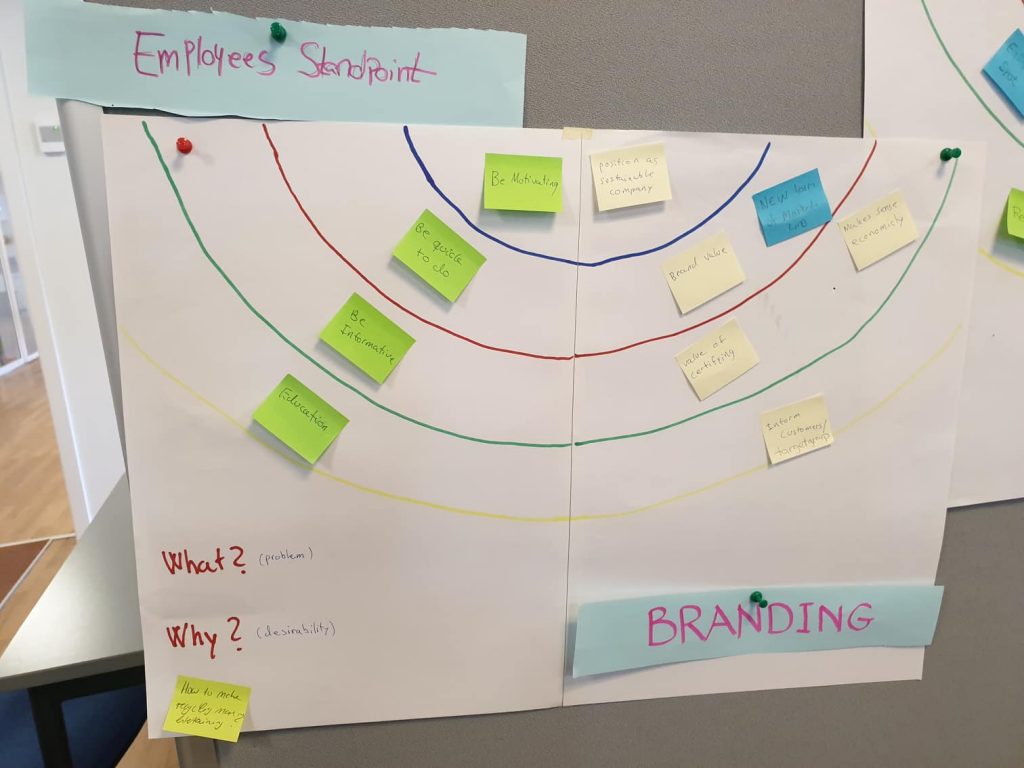
The model consists of a semicircle where there are four rings, where the inner ring is most important, and the other rings are prioritized down by order.
We started by looking at our Affinity chart and out chose one to advise to focus on. Here we gave ourselves 3 minutes here in the group to brainstorm all the things we can come up with that fit the topic we are exploring in. After we have written down our ideas, we talk about our ideas, which we have written down on posted-note. We place the ideas in the model.


Based on our Design Frame Work, we arrived at four innovation tracks, which we will present to Gustav Hansen, for potential focus areas to work on. Innovation tracks are in the areas of Employees Standpoint, Sorting System, Roles and Responsibility, and Branding.

From Quality Criteria to Ideas
After discussing the innovation tracks with the case partners, the group decided to focus on the Roles/Responsibility track. The group spent 10 minutes coming up with “How Might We” questions individually, based on the core design of the innovation track. Afterwards the group members voted on which questions they thought were best suited for moving forward with, and decided to combine the two questions with the most votes into one question, as they were very similar. The “How Might We” question used was: “How might we create a system, that helps communicate sustainability as a value parameter to construction stakeholders?”

Afterwards, the group members spent another 10 minutes to individually come up with ideas for solving the question. Afterwards, each group member selected 2 of their own ideas, which were added around the how might we question. 5 out of the 8 ideas where selected to move forward with through voting, with the remaining 3 being discarded.

Each group member then chose one of the five remaining ideas, as long as it wasn’t theirs, and wrote complimentary ideas for it for 15 minutes. Afterwards the group members presented their complimentary ideas to each other and placed them on the board.

The group members then had 5 minutes to think about which complimentary idea they thought had the most potential to move forward with. Afterwards each group member presented the idea they had chosen and why they thought it had potential. This limited the group down to 3 of the complimenting ideas, which would be used for future sketching and prototyping.

Sketching and prototyping
In this fase we began a sketching and prototyping process. The foci of these were the three ideas from yesterday, i.e. buildings as representing certain values, depicting price / sustainability relations through the use of a slider, and a bronze-silver-gold rating system for buildings.
What we ended up with were three videos. The purpose of these were to communicate our ideas to two other groups, and facilitate a critique session of the designs.
The three videos were as follows:
Buildings as representing certain values.
This video deals with tapping into a new market of clients, for whom the sustainability of buildings is also important. It positions Gustav Hansen as a central actor who ensure communication between diverse groups of people within the building process:
Depicting the relation between price and sustainability
The video shows a slider, that the client is presented with when making decisions about the building. The point of this slider is to communicate the ways price affects sustainability:
A rating system for buildings
The presentation shows how the use of a rating system consisting of bronze, silver and gold categories can be used to connect a sense of value to being sustainable:
Iteration and further refinement
Based on critique achieved from the design critique sessions we focused on developing the slider further. It was pointed out that having multiple sliders for more granular control were a more realistic implementation in order to capture the complexity of the building process. In addition to this we combined the idea of the rating system with the slider implementation, such that the location of the individual sliders were summed and reflected in a bar, indicating a category (bronze, silver, gold).
Based on the new slider, and a rework and combination of our three videos, we produced a final video in order to communicate our ideas: