
Case description:
In collaboration with Port of Aalborg, we have been asked to create a proposition for a digital platform that can enhance and visualize a symbiosis between companies in and around the port of Aalborg. The purpose of the platform is to make it more attractive for new companies who wants to settle in Aalborg, this will be done by making a transparent solution where companies can get the needed information about placement, resources, networks etc. This is done in order to make it clear what they can expect to get in a symbiosis between businesses located in Port of Aalborg. In the end, the platform should be a crucial part of enhancing the green development which is taking place in the companies, the development of a more sustainable city, and part of meeting some of the Sustainable Development Goals that were proposed in 2015 by the United Nations.
Members of the team:
Jessie Holm Ostermann
Nicolai Lykke
Nicolai Søndergaard
Thomas Flemming Lindsten
Tin Hung Vo
Concept video
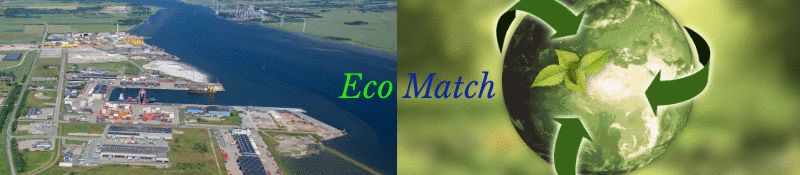
Our final concept video is a product of our process throughout the last two weeks. The video visualizes the platform “Eco-match” which is a tool that Port Of Aalborg can utilize in order to optimize the process between them and the company that wants to be a part of Port of Aalborg. In the video, the platform showcases different features such as the interactive map which shows the best location for the company, and the feature Augmented reality, that can be used to visualize different facts about the chosen land.
Overall, the concept is a decision-making tool for Port of Aalborg to improve the process of localizing new companies on their ground.
THE DESIGN PROCESS
Plan for empirical work
Deliverables hand-in:
On the first day of the Designsprint we were introduced to our case partner Port of Aalborg. The case-challenge they presented was for us to design a digital platform that would provide them with an interactive map of the industrial symbiosis of Port of Aalborg.
The second day began with two lectures; Frameworks for involvement and Jobs to be held. As part of our case partnership with Port of Aalborg, we were invited on a tour of their facilities. During the tour, we were presented with an overview of the company. Afterward, we were able to make an appointment with two of the presenters, Lucia and Rikke, for an interview the following day.
Tuesday:
- Fieldtrip
- Prepare questions for interview
- Make a plan for Wednesday
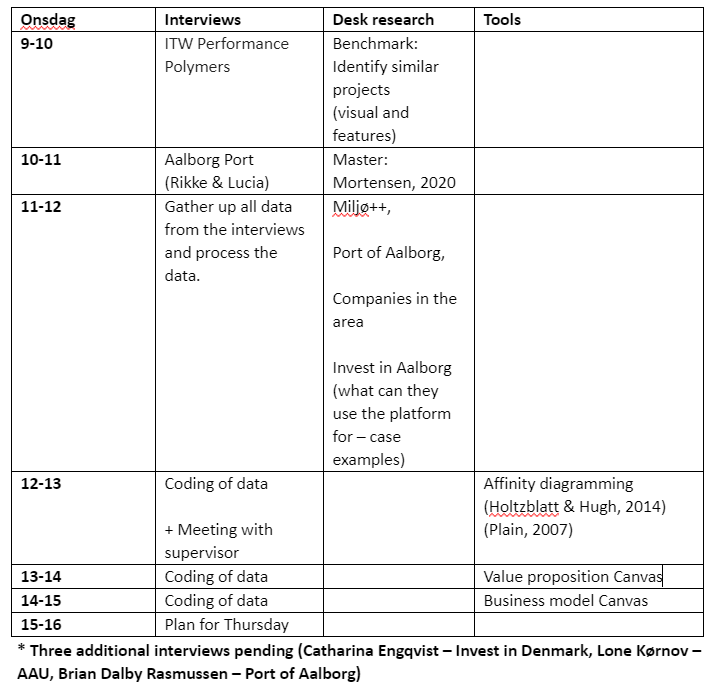
Wednesday:
- Online interview with case-partner (2 group members)
- Try to set up additional interviews
- Additional team-meeting with Lucia and Rikke regarding our vision for the project.
- Desk Research
- Visually similar solutions:
- Features
- Design
- Aalborg Portland:
- About Aalborg Portland
- Companies in the area
- ITW performance polymers etc.
- Benchmark:
- Eco-industry parks Wikipedia
- Kalundborg
- Canada
- Links from Wikipedia
- Coding of data collection:
- Value proposition map
- Business model canvas
Thursday:
- Affinity diagramming
- Find an idea and prepare a pitch
- User story
—
On the third day of the Designsprint, we were able to conduct three virtual interviews. The first one was with Frederik Sommer-Gleerup from ITW Performance Polymers. The next appointment was a shorter interview with Helena, a senior consultant investor from Invest in Aalborg. Finally, we had an interview with two employees, Lucia Mortensen and Rikke Drustrup from Center for Logistik og Samarbejde, who spoke on behalf of our case-partners Port of Aalborg. After gathering data from our three interviews, we moved on to our desk research. Specifically, we were researching for similar interactive flow maps of other ports and companies with the purpose of gathering inspiration. We researched for companies both nationally such as Kalundborg, the largest port in Denmark, and internationally for companies such as AT&T.
Based on the empirical data from our interviews and desk research, we decided to organize our data through methods such as Affinity Diagramming and Value Proposition.
Affinity Diagramming
We started working on our affinity diagram after we were done with our interviews, with the main purpose of organizing our collected data. We had a lot of notes and information from the interviews we conducted, which we felt were necessary to categorize, in order to move forward in our design process. Furthermore, we had all our Desk Research and notes from presentations which we had to categorize. We used Mural.co to complete our diagram.

The first step was giving each set of data (interviews, Desk Research & presentation) a specific color, in order to be able to see where each note of data was from.
Afterwards, we inserted all our data into separate post-it notes, with the corresponding color, which gave us a big mess of different post-it notes with different sets of data. We went through the notes and found similarities in the different colored notes with the different types of data and made headlines, which held the overall meaning of the gathered post-it notes in that category.
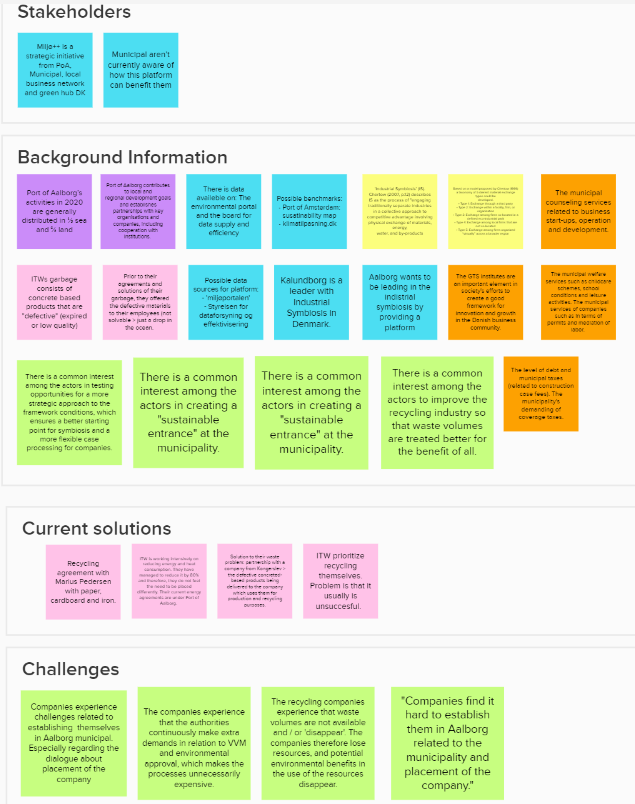
Throughout the process of categorizing the different post-it notes, we had some relevant discussions about the needs, visions and general ideas of what the design was going to be. This was a great way for us to vocalize what the different datasets had given us, what we could use from them and what was possible for us to make into reality through the design. It also gave us an idea of what the different stakeholder wanted us to make, and what their needs and wishes were in relation to the design. The affinity diagram was a great structural process and helped us immensely with our large amounts of data. A lot of things were made clear, but we still needed to find more relevance in these sets of data we made (our categories).
After categorizing every post-it notes in the diagram, we then discussed what the next step for us was. We decided that we wanted to complete a Value Proposition, which would further help in making sense of the data we have.
For a full overview of our Affinity Diagram, please click on the following link:
https://app.mural.co/t/aau0368/m/aau0368/1603884359948/downloads/images?url=aau0368%2Fa0a85a21-3b0e-4317-8193-15df828b162e.png
Value Proposition
To keep track of the all the data we had gathered during our empirical work, plus the categories and information we got from the Affinity Diagram, we started making a value proposition on the fourth day of the Designsprint. The purpose was to create a better overview and to provide us with an idea of the focus we wanted. This was based on all the information collected in the interviews and the desk research done, and all the knowledge we had gained from our categorizing in the Affinity Diagram.
In the value proposition we started by looking at the jobs needed to be done, seen from both PoA, Aalborg municipal and the company’s point of view. Since we found that the different stakeholders in the project had very different ideas of what a platform like this should contain, we felt it was necessary to include both. Thereby, we were able to find a common ground that could benefit all involved in the project.
Pains and gains were addressed in the same manner to visualize where our stakeholders had common pains and gains that would be useful to address in a future solution. An example could be that PoA and Aalborg municipal lacked an overview to attract companies and companies needed the same in order to know how to meet their regulations.
By analyzing our data with the Value Proposition, we were able to make a job selection scheme of different jobs and assignment. Afterwards, we gave the different jobs a number from 1 – 5 based on the importance of it, 5 being the highest priority. That would give us the direction to look deeper into regarding the project and thereby, create a list of priorities based on the importance of the jobs for Port of Aalborg, Aalborg Municipality and the surrounding as well as potential companies.
Material storytelling

After creating our affinity diagram and value proposition, we realized that we had more time for data collection and data exploring. In relation to this, we started by thinking new ways and Peter mentioned that we needed to participate in the Material storytelling workshop.
Anne and Thomas went to The University, and Jessie observed from online video. Anne and Thomas started by collecting objects and placing them in the sand box.
This workshop were unexpected, based on our other methods being done before our time schedule.
The workshop helped us by visualizing the problem, and all the participants in the process. Followed it helped us to deselect areas and only highlights the important aspects for the case. It can be concluded that the workshop helped us to sort of empirical data and knowledge from interviews the days before, and we ended up visualizing and dialoging about the design, and what we view as important factors for the design we want to create during design sprint.
Reflective and observative role:
The participant Anne and Thomas started out with setting up the camera and then the possibility for me to observe the workshop.
The beginning:
Anne and Thomas started by walking around the room, and looking around the area with the other participants of the workshop, they were told to walk around, and gather things with the other groups.
Thomas and Anne started gathering materials and props and placed them in silence into the box with sand. The probs were a combination of threads, objects, toys and so on.
By the workshop starts with a set-up like this, I observe it gives the participants a “free” space to collect the things that they find interesting, and by them doing it in silence, there are no distractions from the other participants.
After the 20 minutes, they needed to look at the small details, if the participants wanted to change up the set-up, or maybe take things out or relocate objects, they could do it now. This part of the workshop is still done in silence.
Reflective round – How is the participants talking about the things – patterns or things they don’t mention.
Thomas stakeholders, companies and the municipality – He tried to showcase that Aalborg municipality is number one, and gave Port of Aalborg an unicorn, because the project is very new and it is ambitious. He tried to showcase the stakeholders have a more “laidback” role, and that they can relax. Moreover, he showcased things with the environment, and that the companies has “skeleton in the closet” like you say in danish, and that they need to emphasize the issues companies has with all their waste.
At the end Thomas placed a brain in the middle, which is supposed to be the group and the group work, and that we are the brain behind it.
Anne tried to place her objects in regards to emphasize the thing we are working with, which is the symbiosis. Where she tried to showcase the connections between the symbiosis and the municipality. Anne placed the product in the middle with more layers to the digital concept that we need to visualize.
She emphasized the challenges that the product could be facing, and the challenges that could make it difficult for us as well.
Conclusively, it can be observed and reflected that Anne and Thomas highlighted some of the same products, and wanted to emphasize this bigger picture of the symbioses and all the stakeholders whom are in play with this project. They both visualized the network of connections into a round area, where they placed the group in the middle of it all as a visualized aspect of the concept is our responsibility to create, but that there is many stakeholders to take into considerations.
Followed the reflective round, Anne and Thomas got to relocate the objects to try to see it from another view.
It could be observed that Anne and Thomas started working together by visualizing the objects, and what they could collect together, if they had things highlighting the same issue or area of our case.
They started a dialog regarding the objects, and how they could find a middle ground of what it symbolizes and how it could be place best in the sand box.
Followed the dialog about the objects, the participant were told to turn around and go to the other side of the table
I observed that Anne and Thomas started a different dialog, and thinking more in relation to the case. They saw it from a new perspective, and started to visualized the objects and said it were not that visible as they thought before.
They started to talk about the project more, and it became more visible for Thomas and Anne.
Reflective they came to the conclusion that the group has an idea, but we need to take into consideration to other things, to make sure there is a clear connection to all the stakeholders before starting thinking about the design.
But on the other hand, they started by talking about time, and how much can we implement into the project, and it is observed that they started to talk about “How to design? The core essence of the design. “
The pattern started to show that Thomas and Anne started dialoging outside the objects and started a conversation regarding the solution: how to visualize and communicate the design = keep it simple.
__
Summary of quality criteria’s
Before deciding on 5 innovation tracks, we went back and looked at our affinity map to do a brainstorm on different possible qualities that we could use as criteria in the innovation tracks. Based on the brainstorm we then categorized the qualities/criteria we decided on into 8 different topics. From there it was easy to start forming different innovation tracks that each had different focuses but at the same time included our stakeholders different focus areas.
Symbioses
Focuses on enhancing sustainability through finding symbioses between existing and new companies in and around Port of Aalborg. That is done though information overview looking into network creation and resource exchange between companies.
Companies
The exchange of resources between companies is the focus here. For that to happen companies want a very easy to use platform (could be like stock exchange), with all relevant information available that enables communication between businesses to run smooth.
Branding Sustainability
In this innovation track the fucus is on branding of Port of Aalborg and Aalborg municipality to attracted new businesses by visualizing the sustainable advantages through a platform with an informative overview.
Optimizing
This innovation track focus on the optimization, with focus points like information overview and user friendly. All this should provide better and quicker decision development.
Functional Tool
The functional tool has its focus on decision making and optimizing the process, by providing relevant information in an easy-to-use platform.
Based on the meeting with our case partner, we found in collaboration with PoA that a focus on creating a decision-making tool that can help optimize the processes in placing companies and get them started as quickly as possible would have the greatest value for PoA. Therefore, we will further develop a digital concept that will help meet that decision.
—
HMW & Ideation framework
Elaborating further on our quality criteria (the decision-making tool) made through a collaborative decision with our case partner Port of Aalborg, we dove further into the process today. We took our quality criteria and transformed it into ‘How Might We’ questions in order to transform our quality criteria into a solution with concrete features. Firstly, each member of the group developed three HMW questions each and then we voted for the best HMW question to answer based our quality criteria. Our HMW question goes as following: “How might we give Port of Aalborg the best tool, to be able to advise and give optimal service for companies related to placement and getting started.”
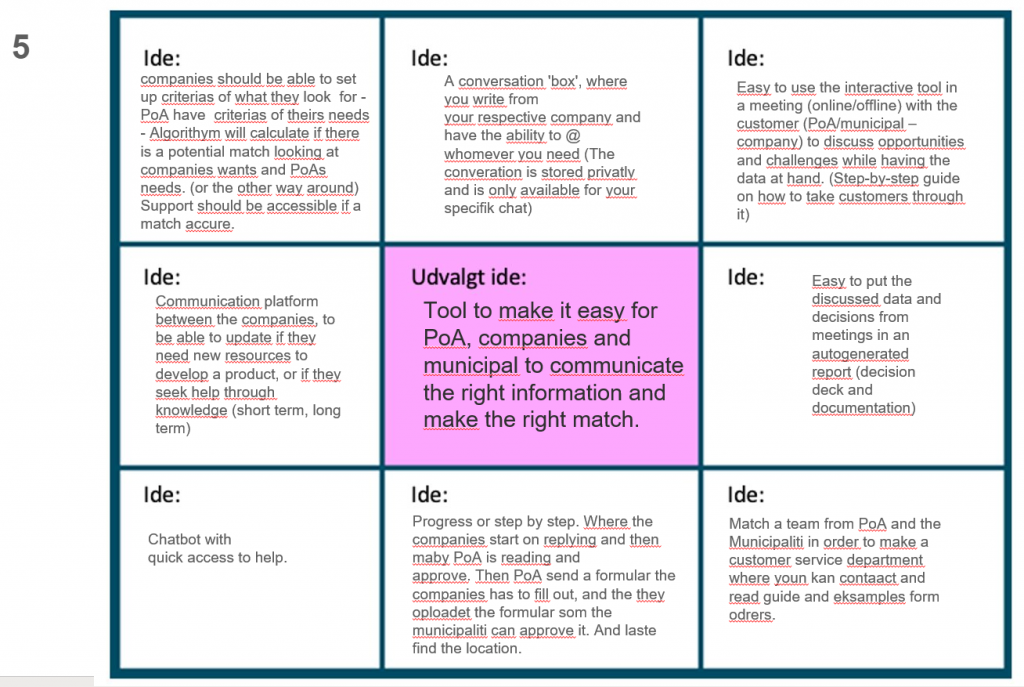
Next, we used the Ideation framework presented to us by our lecturers to find the global maxima of our HMW question. Working with the Ideation framework, we had to generate 8 ideas based on our HMW question and afterward we evaluated them and selected the best 5 ideas.
The 5 ideas were improved ad refined by further complementing these ideas with 8 more ideas. Our five ideas consisted of:
1) An interactive map with filters that will provide an overview.
2) A search tool that helps you filter your search for a specific solution for the most optimal location.
3) Media that gathers and presents all relevant information.
4) A benchmark tool where you will get the location based on the calculated entered the information.
5) A tool to make it easy for PoA, companies, and municipal to communicate the right information. and make the right match.
Below you will find 5 ideas and the 8 ideas surrounding each of them.


Finally we choose the following three ideas to answer our quality criteria:
- Interactive map with different layers/information important for the decision.
- Company input (Q&A with PoA) on their needs/requirements to generate an auto search for a location and for PoA to know their needs.
- The tool can be used in the communication between PoA/municipal and the companies to enhance and document the decision process.
Sketches of the concept
Prototype 1 – Stopmotion video sketch:
This video sketch was made through hand-drawn sketches which illustrates a possible scenario between Port of Aalborg and a company where our solution would come into play. The idea is to make the decision process easier for Port of Aalborg to choose a location for a new company. The parties involved are Port of Aalborg, ECOMATCH, and a new company interested in a location at PoA.
Prototype 2 – The green screen/augmented reality:
This video sketch shows a video of how PoA could make use of an augmented reality application to show new companies around. Specifically, information and other important facts on each location would be shown.
Prototype 3 – Figures:
Our figures illustrate how a potential scenario of the beginning of the whole process between PoA and a new company. A new company is looking for information on PoA because they want to locate their business on their grounds. Next, they call PoA to set up a meeting. After the call, PoA shows frustration because they don’t have the right digital solution which ends with them calling for the solution makers: ECOMATCH.