
Affinity Diagram
First step of the process – Gather Data during field trip
Second step of the process – Cluster Data


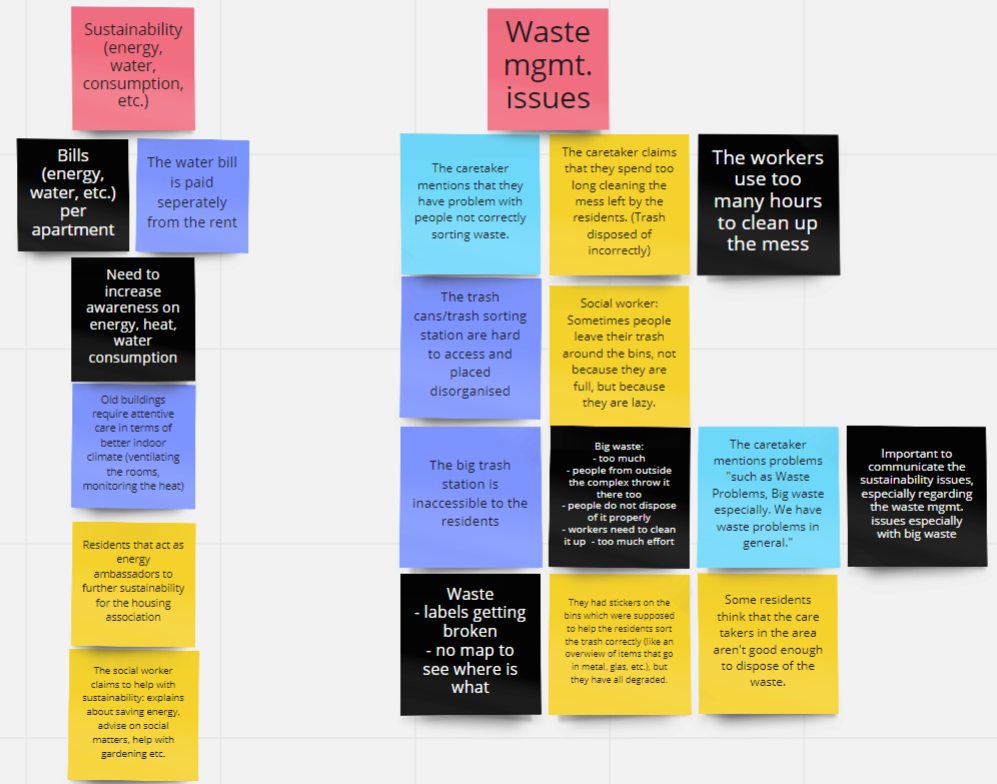
Third Step – Create Affinity Diagram with the clustered data


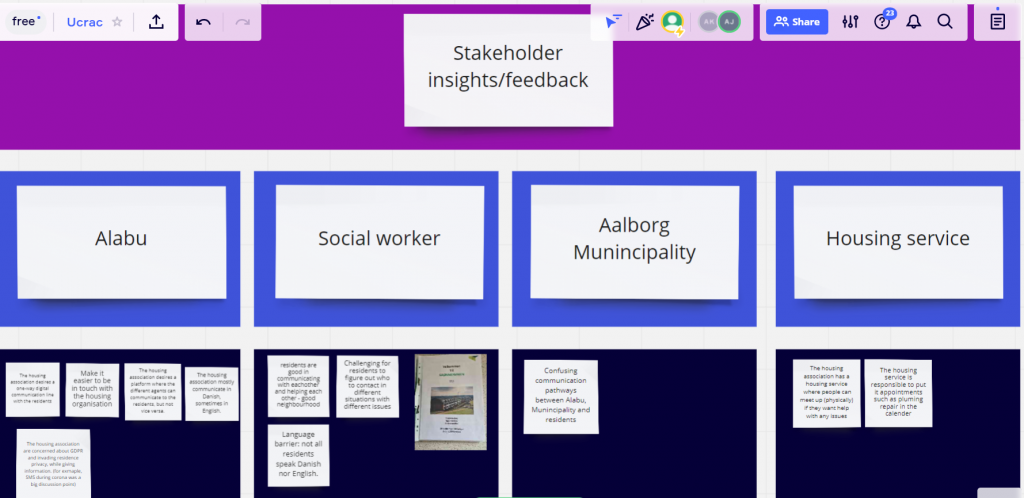


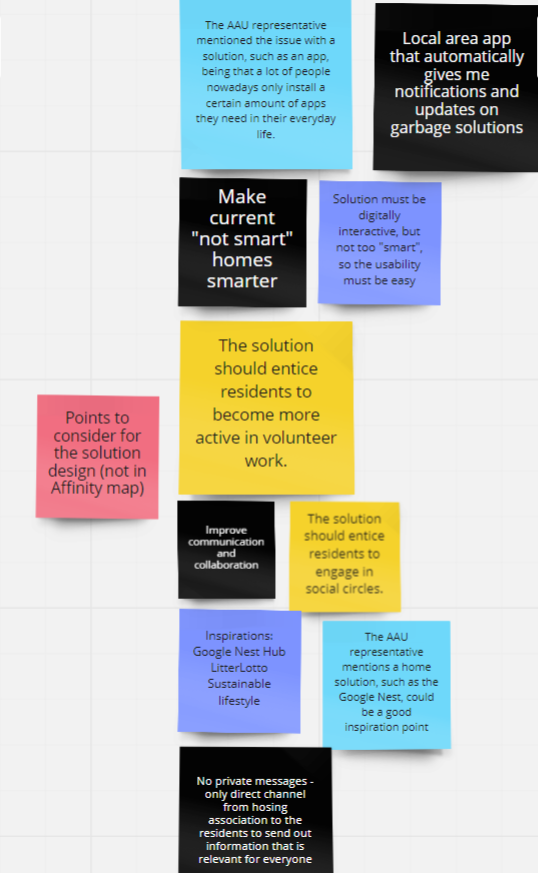
The following cluster represents insights received on the goals of the stakeholders regarding the solution. These have not been included in the Affinity Diagram but they shall be taken into consideration during the design process.
Core Design Development
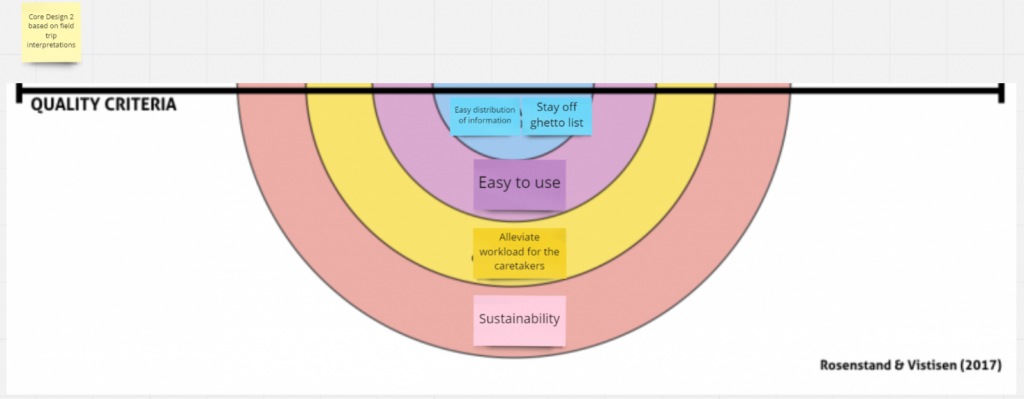
For the core design quality criteria have to be identified. For this purpose we have looked at the insights/field data recorded in the Affinity Diagram. Based on those, we have derived various quality criteria that can mainly be categorised into quality criteria for communication and quality criteria for sustainability.


Having the quality criteria identified, we have moved on to creating various core designs, based on the methodology proposed in the class.
The first core design is based merely on criteria identified from the written case presentation. In our point of view, this is not the optimal core design, as too many different criterias have to be met on the different levels. Furthermore, this shows how broad the problem area is. For the purpose of design thinking and design sprint, we propose to narrow down the problem and focus in this process on one piece, that we consider to be the most relevant one.

The second core design is based on interpretations derived from the field trip insights. This summarizes criteria mainly from the housing association and the social worker.
The next two core designs are focused on more concrete workstreams.
On the one hand, we have the communication workstream with the goal to improve communication with the residents by easily distributing information, which has been identified as the main goal for the housing association.

On the other hand, we have the sustainability workstream, with the goal to promote sustainable behavior, which has been identified as the main goal for the Aalborg Municipalty and partially for the housing association.

Lastly, we have created a fifth core design, which represents a combination between the last two presented above. This core design focuses on improvind communication by easily distributing the necessary information to the residents, which is one of the main focus points for the housing association. Furthermore, it also includes a focus on sustainability, by enabling easy share of correct information on sustainable behavior. Research has shown that, in order to change the mindset and behavior of people regarding sustainability and the environment, the first step is providing the right information at the right place. This point also helps fulfil the goal of the Aalborg Municipality and the housing association.

We highly recommend to follow the fifth design proposed above in the ideation and prototyping sessions to come.
Feedback after the case partner meeting
Present: Sandra (AAU representative)
Not Present: Alabu and Aalborg Municipality representative
All in all we are on the right track. However, we should not let ourselves be limited by the notion of “only digital solution” and acknowledge how broad the case is. We have been advised to open up our solution space more and focus in the design sprint on a possible solution that represents a bridge between the physical and the digital world. Integrating semiotics will help, in our view, to find the “digital” in the physical world. This helps with simplyfying information/processes for residents by increasing transparency and convenience.
It has been confirmed that the different case partners might have contradicting perspectives for this case. We have been encouraged to challenge it.
In addition to that, it has been pointed out that sustainability is a main focus, not only for the Aalborg Municipality, but also for Alabu, as the green transition affects the housing associations as well. Therefore, communication might not be the right main focus.
We have been encouraged again to think broader (e.g. beyond only a digital solution), point out how complex the problem is and pick a specific piece to exemplify in our prototype.
HMW and Ideation
How Might We Question
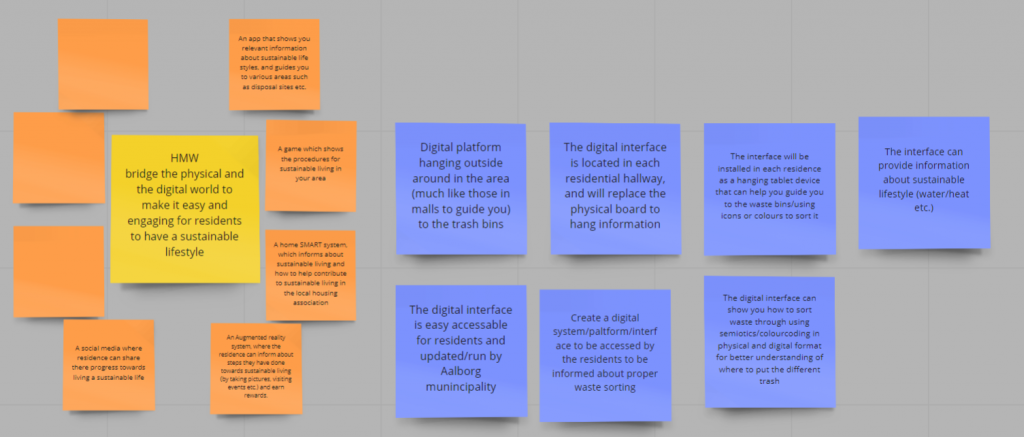
To identify the HMW question we have started with an individual brainstorming session. Each teammember was responsible for formulating at least 3 HMW questions based on the core of the designs developed last Friday and on the feedback received from the meeting last Friday. Then, as a group, we have looked at every HMW questions and clustered and summarised them.


Next, we have jointly voted and formulated our final HMW question: “How Might We bridge the physical and the digital world to make it easy and engaging for residents to have a sustainable lifestyle”

After having identified the HMW question, we moved on to the ideation process by using the Idea Cube methodology presented in the class.
Idea Cube
As a first step, to create the first idea cube, we brainstormed individually on various ideas for possible solutions that adress our HMW question.

As a second step, the team chose the top 8 ideas for the final idea cube. Having done this, the next step was to choose the top 5 ideas via dot voting. Below you can see the final cube and the final 5 ideas pointed out via magenta coloured circles.

Finally, we worked with the idea cube to deep dive into the 5 chosen ideas and try to specify and optimize them.


The idea cubes marked with a star represent the top 3 final ideas that we have chosen to continue with in the next steps of the design thinking process.
Video Sketching
Now having created 3 final ideas, we wanted to convey these ideas in a way that allows for easy discussion with our peers. For this, we choose to use Video Sketching. We created 3 videos, one centered on the case of disbursing trash, one which centered on saving money by being aware of heating, and one which focused on a tablet-based solution and how that could be used in action.
Video Sketch 1
Video Sketch 2
Video Sketch 3
Final Video and Solution Concept
Our solution concept represents a digital interface called SLAM (Sustainable Living Aalborg Municipality). This interface wil be implemented in form of a digital information board placed near the entrance door in every apartment, as well as in form of an app which each resident should install. This digital interface contains: a “News & Events” Section, which will show the newest news and events created by the housing association (Alabu) and the Aalborg Municipality, a “Residence Infomation” section, where only the information relevant for the residents will be there (such as contact information, what to do when you move in, how to prepare the apartment when you move out, a map of the whole housing complex, etc.), a “Housing Service” section, where information such as the most important contact persons/place and updates from the housing association will be included, a “Calendar” section with a calendar including an overview of all upcoming events from Alabu, the social workers and Aalborg Municipality, and a “Trash” section with information on sustainable sorting and disposal of waste as well as a map of where the trash containers are placed in the housing complex.
For the puroposes of this project, the following video exemplifies how the application/digital interface can be used in order to find information on sustainable trash sorting and disposal. This feature of the digital interface is meant to tackle the current waste management issue pointed out during the field trip. Furthermore, the feature will make it easy and comfortable for residents to look up information on what type of trash belongs where as well as where to find the nearest trash container for the type of trash the resident wishes to dispose of. In this simple, digital way, the residents are accomodated and they are encouraged to improve their behavior towards sustainability and waste management.
Enjoy the video below:
Here you can find a written detailed explanation of the scenario presented in the video above:
David is introduced in the scene. A voice in the background: “This is David, he lives in Grønneparken, Aalborg Øst.”
The start of the film shows a messy kitchen where David enters from the side.
David turns to the kitchen table where it is zoomed in on the messy table with his back in the foreground. There are different kinds of trash on the table: cardboard, glass bottle, and residual trash.
David with his back against the scene: “damn it’s such a mess out here after the party last night”
David turns around and says frustratingly: “how am I going to sort all this!?”
David is unsure what trash goes where: “hmm, so much different trash, I need to figure out what goes where…”
He gets an idea “oh right, I can look it up!”
David goes to the door entry.
He looks it up on his information board in near the entry way.
David clicks on the trash icon at the bottom of the screen, and information about how different kinds of trash are sorted, he clicks on glass and a list of different items shows up, and then the scene zooms in on the screen. The screen is divided with a small map, and different kinds of glass to be sorted in the glass trash container.
David turns around and is pleased to have an idea of how to sort his trash.
He goes back to the kitchen (Flip the first scene, so he is walking the opposite direction).
The scene zooms in on an open trash bag, where he puts glass in one trash bag, and another with residual trash in a bag.
The scene shows his hand holding three different trash bags (with labels on them to indicate the contents).
David, with his back against the scene, goes out to his entry way and out of his home.
He is walking towards the trash containers closest to his apartment and throws the bag with residual trash and paper out.
He is still holding the trash bag with glass in his hand, and is now confused where to put it, since the glass container is not there.
David is thinking of a solution (question mark), and then he remembers the app (lightbulb) he has installed on his phone.
The scene shows a hand holding a phone with the same interface as the information board in his entry way. The scene then shows another hand pressing the trash icon.
The scene zooms in on the interface (same as earlier), and then shows the hand clicking on glass and then further clicking on the map, to scale it up. On the map, is shown an icon for the glass container, and then he clicks on it, to show an image of the surroundings of the glass container.
David is walking to the glass container with one bag in his hand and throws it out.
David is now happy and well informed about sustainable trash sorting and disposal in his area.
Thank you
We would like to thank the Aalborg University inlcuding the professors and the university representants for the case study as well as Aalborg Municipality, Alabu as well as the volunteers at Grønneparken for trusting us to work on this project with them.